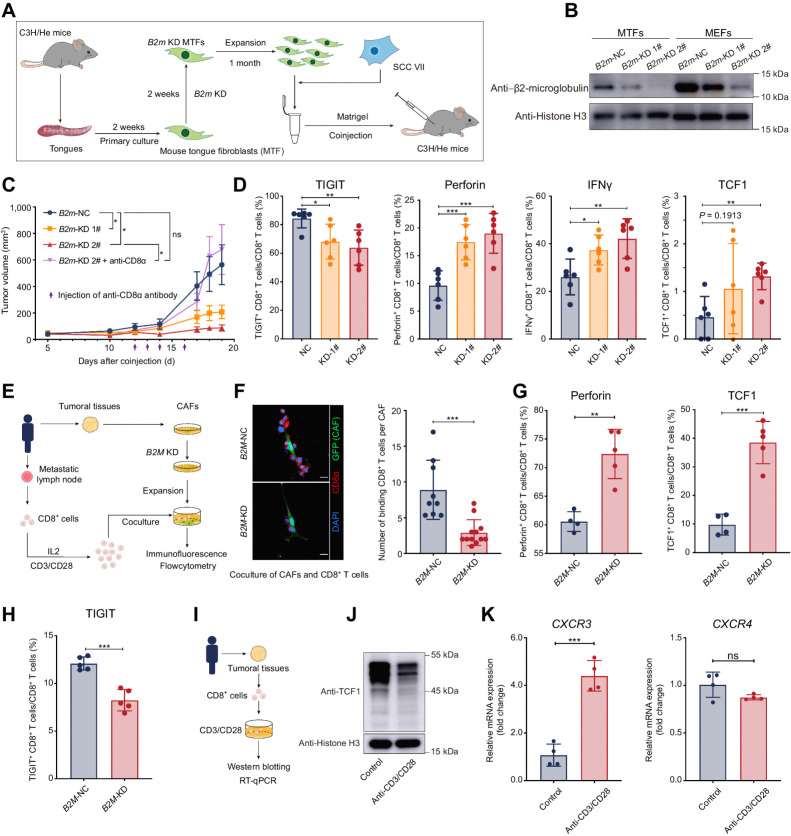
Figure 4.
Higher expression of MHC class I limited the antitumor function of CD8+ T cells. A, Schematic diagram of coinjection of subcutaneous tumor models for mouse tongue fibroblasts and SCC VII. B, Western blotting of β2-microglobulin in MTFs and MEFs. C, Tumor growth of subcutaneous coinjection of SCC VII and B2m knocked-down (B2m-KD) MTFs. Purple arrows, intratumoral injection time points of the anti-CD8α antibody or saline. D, The proportion of CD8+ T-expressing cytotoxic cytokines (perforin and IFNγ), the immune checkpoint (TIGIT), and TCF1 in CD8+ T cells isolated from subcutaneous tumors formed by coinjection of SCC VII and MTFs. E, A diagrammatic sketch for coculture experiments of B2M-KD CAFs and CD8+ T cells from the same patients. F, Left, immunofluorescent results for the CD8+ T cells binding to B2M-KD CAFs. Right, the average numbers of CD8+ T cells binding to one CAF are summarized. G, The flow cytometry results of expression for perforin and TCF1 in CD8+ T cells after coculturing with CAFs. H, The flow cytometry results of expression for TIGIT on CD8+ T cells after coculturing with CAFs. I, A diagrammatic sketch for isolation of CD8+ cells from HNSCC tumoral tissues and activation of TCR signaling in CD8+ cells by anti-CD3/CD8 antibody. J, Western blotting of TCF1 in CD8+ cells isolated from HNSCC tumoral tissues after TCR signaling activation. K, The mRNA expression changes of CXCR3 and CXCR4 in CD8+ T cells isolated from HNSCC tumoral tissues treated with or without anti-CD3/CD28 antibody. Statistics are shown in mean ± SEM (C) or mean± SD (D, F–H, and K) accessed by the unpaired t test. *, P < 0.05; **, P < 0.01; ***, P < 0.001; ns, nonsignificant.

