. 2023 Nov 6;84(2):258–275. doi: 10.1158/0008-5472.CAN-23-1448

Figure 5.

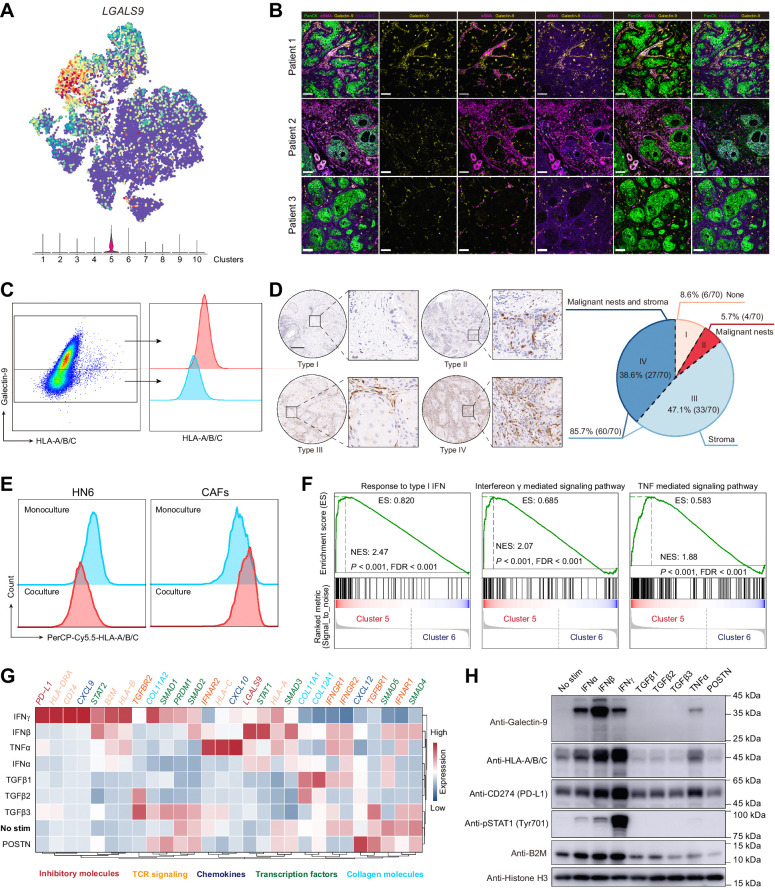
Figure 5. The immune checkpoint ligand molecule, galectin-9, was enriched in cluster 5 of CAFs. A, The t-SNE result of fibroblasts overlaid with LGALS9 (the gene encoding galectin-9). B, Representative immunofluorescence results of human HNSCC tumor samples stained for pan-cytokeratin (PanCK; green), αSMA (wine), galectin-9 (yellow), HLA-A/B/C (purple). Scale bar, 80 μm. C, Galectin-9 and HLA-A/B/C expressions in CAFs from human HNSCC tumor samples. The gating strategy for CAFs is presented in Supplementary Fig. S7C. D, Left, representative images of HNSCC tissue chip for different distribution patterns of galectin-9. Scale bar, 200 μm. Right, the proportions for four types of galectin-9 distribution are also summarized. E, Flow cytometry of HLA-A/B/C expression for monocultured or cocultured HN6 and CAFs. F, GSEA for cytokines-associated pathway enrichment of differentially expressed genes between clusters 5 and 6 CAFs. G and H, Gene expressions in CAFs treated with different cytokines (IFNα, IFNβ, IFNγ, TGFβ1, TGFβ2, TGFβ3, TNFα, and POSTN; the concentration of cytokines was 100 ng/mL). G, CAFs treated with cytokines for 24 hours were harvested for mRNA isolation and qRT-PCR. The data were pooled from three independent experiments and the relative expressions of targeted genes were analyzed relative to GAPDH or ACTB. H, CAFs treated with cytokines for 48 hours were harvested for Western blotting.

The immune checkpoint ligand molecule, galectin-9, was enriched in cluster 5 of CAFs. A, The t-SNE result of fibroblasts overlaid with LGALS9 (the gene encoding galectin-9). B, Representative immunofluorescence results of human HNSCC tumor samples stained for pan-cytokeratin (PanCK; green), αSMA (wine), galectin-9 (yellow), HLA-A/B/C (purple). Scale bar, 80 μm. C, Galectin-9 and HLA-A/B/C expressions in CAFs from human HNSCC tumor samples. The gating strategy for CAFs is presented in Supplementary Fig. S7C. D, Left, representative images of HNSCC tissue chip for different distribution patterns of galectin-9. Scale bar, 200 μm. Right, the proportions for four types of galectin-9 distribution are also summarized. E, Flow cytometry of HLA-A/B/C expression for monocultured or cocultured HN6 and CAFs. F, GSEA for cytokines-associated pathway enrichment of differentially expressed genes between clusters 5 and 6 CAFs. G and H, Gene expressions in CAFs treated with different cytokines (IFNα, IFNβ, IFNγ, TGFβ1, TGFβ2, TGFβ3, TNFα, and POSTN; the concentration of cytokines was 100 ng/mL). G, CAFs treated with cytokines for 24 hours were harvested for mRNA isolation and qRT-PCR. The data were pooled from three independent experiments and the relative expressions of targeted genes were analyzed relative to GAPDH or ACTB. H, CAFs treated with cytokines for 48 hours were harvested for Western blotting.