Figure 6.
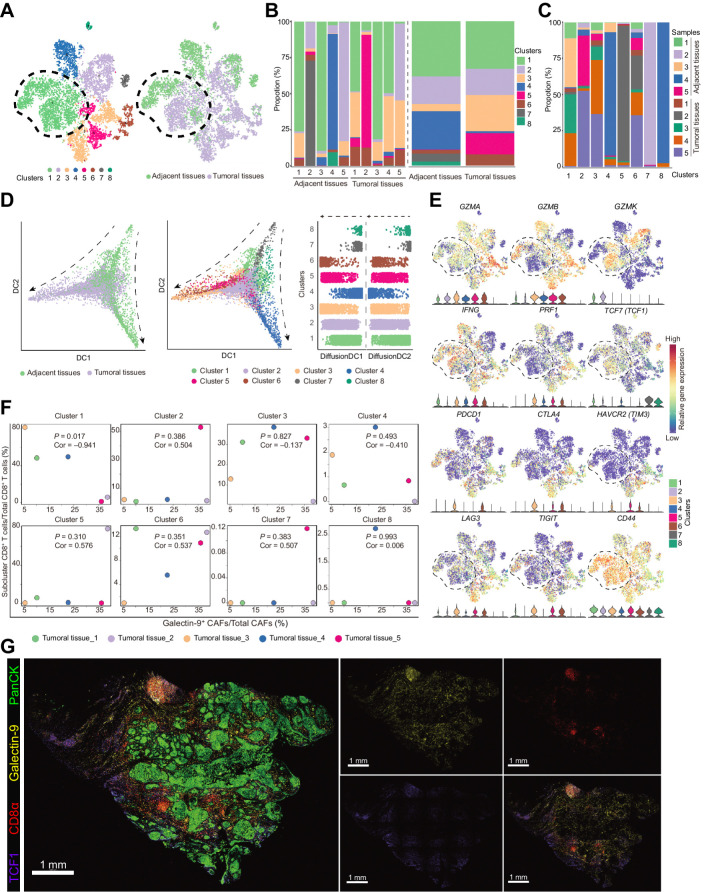
TCF1+GZMK+CD8+ T cells were negatively correlated with galectin-9+ CAFs. A, t-SNE plots of single-cell RNA sequencing result for the CD8+ T cells from the previous 5 paired tumoral and adjacent normal tissues. Cells were clustered into 8 populations (left) and origins (right) are also indicated in the t-SNE plots. B, Bar plots show cluster proportions in tumoral and adjacent tissues (left) and cluster proportions (right) in each sample. C, Bar plots show sample fraction in each cluster. D, Pseudotime analysis of CD8+ T cells by “DiffusionMap” algorithm. Cells were labeled by tissue origins (left) or clusters (middle). Right, the top two major diffusion compounds distribution of cells from different clusters. Arrows, differentiation directions. E, Regression analysis of the fraction of galectin-9+ CAFs in total CAFs and the fraction of eight clusters of CD8+ T cells from the 5 tumoral tissues. F, Expression of genes defining cytotoxic functions (GZMA, GZMB, GZMK, IFNG, and PRF1) and status (TCF1, PDCD1, CTLA4, HAVCR2, LAG3, and TIGIT) of CD8+ T cells and the genes coding the receptors of galectin-9 (CD44, HAVCR2) in the 8 clusters of CD8+ T cells. G, Representative immunofluorescence results of human HNSCC tumor samples stained for PanCK (green), galectin-9 (yellow), CD8α (red), and TCF1 (purple). Scale bar, 1 mm.

