. 2023 Nov 6;84(2):258–275. doi: 10.1158/0008-5472.CAN-23-1448

Figure 7.

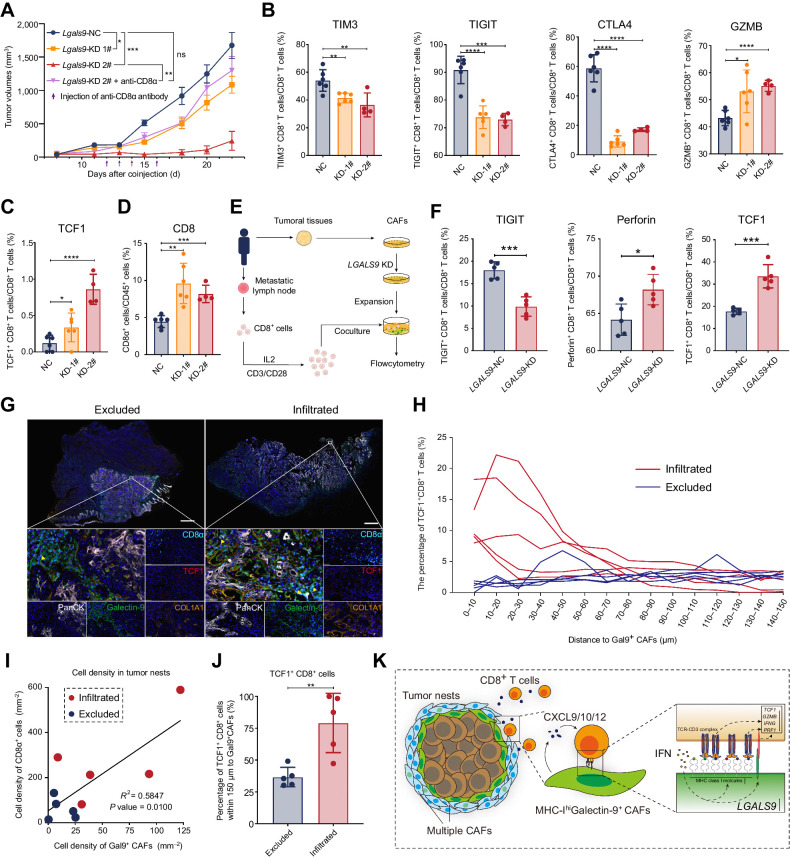
Figure 7. Galectin-9+ CAFs were associated with dysfunctional differentiation of TCF1+ CD8+ T cells. A, Tumor growth of subcutaneous coinjection of SCC VII and Lgals9-KD MTFs. Purple arrows, intratumoral injection time points of the anti-CD8α antibody or saline. B and C, The flow cytometry results of the proportion of CD8+ T expressing the immune checkpoint (TIM3, TIGIT, and CTLA4), the cytotoxic cytokine (granzyme B, GZMB) and TCF1, which are isolated from subcutaneous tumors formed by coinjection of SCC VII and MTFs. D, The proportion of CD8+ T cells in CD45+ cells in subcutaneous tumors formed by coinjection of SCC VII and MTFs. E, A diagrammatic sketch for coculture experiments of LGALS9-KD CAFs and CD8+ T cells from the same patients. F, The flow cytometry results of expression for TIGIT, perforin, and TCF1 in CD8+ T cells after coculturing with CAFs. G, Representative multiple immunofluorescent staining results of excluded or infiltrated HNSCC tumor samples stained for PanCK (white), galectin-9 (green), CD8α (cyan), TCF1 (red), and COL1A1 (orange). Yellow arrows, TCF1+CD8+ T cells around Gal9+ CAFs. Scale bars, respectively, indicate 2 mm in the large-scaled images and 50 μm in the magnified images. H, Distribution of the distances between TCF1+ CD8+ cells and galectin-9+ CAFs nuclei for 5 pairs of excluded and infiltrated HNSCC tumors. I, The percentage of TCF1+ CD8+ cells within 150 μm to galectin-9+ CAFs in the excluded and infiltrated HNSCC tumors. J, Correlation between cell density of CD8α+ cells and galectin-9+ CAFs in the 10 HNSCC tumors. K, Illustration of mechanisms for restriction of TCF1+GZMK+CD8+ T cells by MHC-IhiGal9+ CAFs. Statistics are shown in mean ± SEM (A) or mean ± SD (B–D, F, and J) accessed by unpaired t test. *, P < 0.05; **, P < 0.01; ***, P < 0.001; ****, P < 0.0001.

Galectin-9+ CAFs were associated with dysfunctional differentiation of TCF1+ CD8+ T cells. A, Tumor growth of subcutaneous coinjection of SCC VII and Lgals9-KD MTFs. Purple arrows, intratumoral injection time points of the anti-CD8α antibody or saline. B and C, The flow cytometry results of the proportion of CD8+ T expressing the immune checkpoint (TIM3, TIGIT, and CTLA4), the cytotoxic cytokine (granzyme B, GZMB) and TCF1, which are isolated from subcutaneous tumors formed by coinjection of SCC VII and MTFs. D, The proportion of CD8+ T cells in CD45+ cells in subcutaneous tumors formed by coinjection of SCC VII and MTFs. E, A diagrammatic sketch for coculture experiments of LGALS9-KD CAFs and CD8+ T cells from the same patients. F, The flow cytometry results of expression for TIGIT, perforin, and TCF1 in CD8+ T cells after coculturing with CAFs. G, Representative multiple immunofluorescent staining results of excluded or infiltrated HNSCC tumor samples stained for PanCK (white), galectin-9 (green), CD8α (cyan), TCF1 (red), and COL1A1 (orange). Yellow arrows, TCF1+CD8+ T cells around Gal9+ CAFs. Scale bars, respectively, indicate 2 mm in the large-scaled images and 50 μm in the magnified images. H, Distribution of the distances between TCF1+ CD8+ cells and galectin-9+ CAFs nuclei for 5 pairs of excluded and infiltrated HNSCC tumors. I, The percentage of TCF1+ CD8+ cells within 150 μm to galectin-9+ CAFs in the excluded and infiltrated HNSCC tumors. J, Correlation between cell density of CD8α+ cells and galectin-9+ CAFs in the 10 HNSCC tumors. K, Illustration of mechanisms for restriction of TCF1+GZMK+CD8+ T cells by MHC-IhiGal9+ CAFs. Statistics are shown in mean ± SEM (A) or mean ± SD (B–D, F, and J) accessed by unpaired t test. *, P < 0.05; **, P < 0.01; ***, P < 0.001; ****, P < 0.0001.