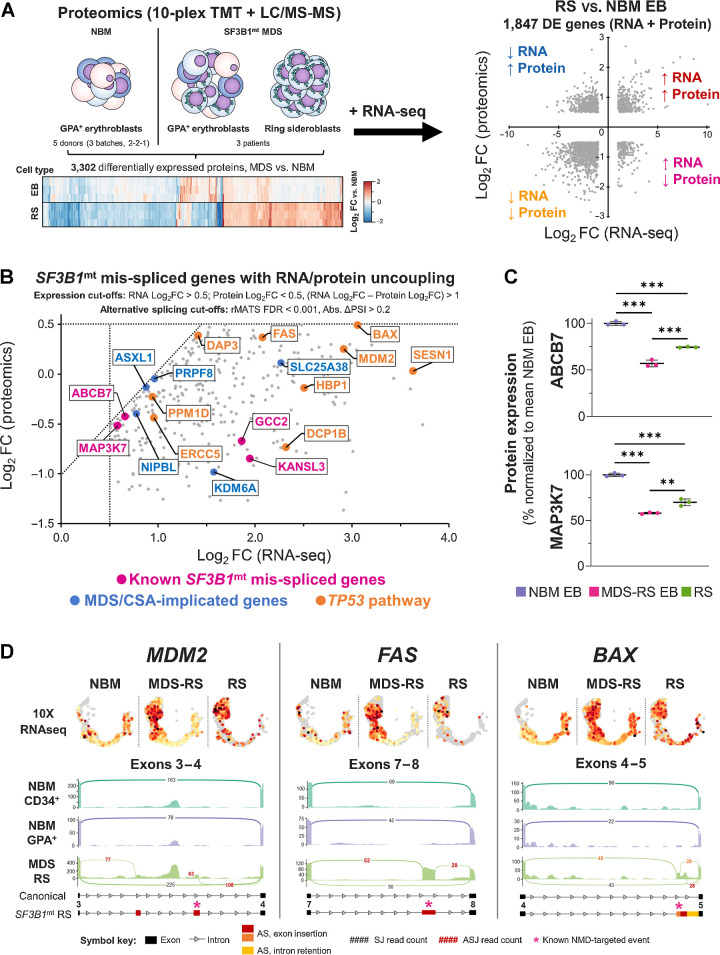
Figure 7.
Proteomic analysis of SF3B1mt RS defines RNA/protein uncoupling downstream of RNA mis-splicing with severe dysregulation of proapoptotic genes. A, Design of a combined transcriptomic and proteomic analysis of SF3B1mt RS. Erythroblast (EB) samples from five NBM donors (separated into three biologically distinct batches) and paired EB + RS samples from three patients with MDS-RS were subjected to semiquantitative proteomics. RNA-seq DE genes are compared against differentially expressed proteins to obtain four major signatures of differential expression, which are highlighted in each quadrant and correspond to the gene ontology enrichment results provided in Supplementary Table S4. B, Scatter plot of SF3B1mt mis-spliced genes with uncoupled RNA and protein expression in RS as compared with NBM EB. RNA and protein expression cut-offs were applied to limit analysis only to genes with RNA Log2FC > 0.5, Protein Log2FC < 0.5, and a difference between RNA and protein Log2FC values > 1 (RNA Log2FC – Protein Log2FC). AS detection cutoffs were followed as indicated in Fig. 6A (FDR < 0.001; Abs. ΔPSI > 0.2). Pink, known SF3B1mt mis-spliced genes (Fig. 6D). Blue, MDS/CSA-implicated driver genes (Fig. 6E). TP53 pathway/proapoptotic genes were detected through enrichment analysis and are highlighted in orange. C, Mean (±SEM) protein expression levels of ABCB7 and MAP3K7, normalized to mean NBM expression. D, 10x single-cell RNA-seq cross-validation of increased RNA expression for TP53 pathway genes MDM2, BAX, and FAS, with gene expression values overlaid in the HSPC/erythroid UMAP projection and separated by sample type. Below each gene, sashimi plots display major mis-spliced transcript regions. Black, canonical splice junction counts (SJ); red, cryptic SJ counts. A full legend for the sashimi plots is provided below the graph. The asterisks indicate sites corresponding to transcripts canonically targeted by NMD. *, P < 0.05; **, P < 0.01; ***, P < 0.001; ns, nonstatistically significant.

