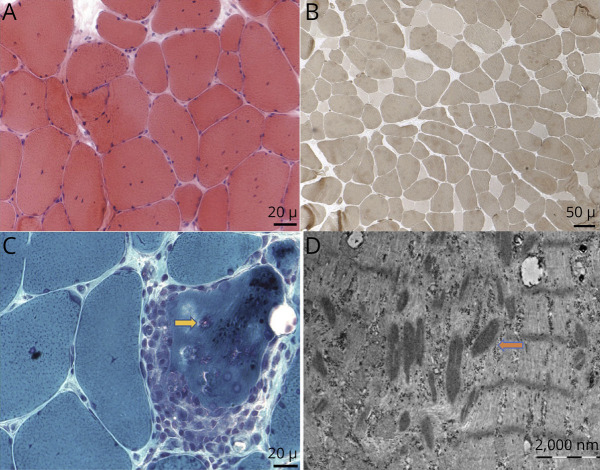
Figure 2. Muscle Histopathology of Patient-III.
(A) Hematoxylin and eosin—fiber size variability, internally placed nuclei, and fiber splitting (×400). (B) ATPase pH 9.4—type 2 predominance (×200). (C) Modified Gomori trichrome—inflammatory foci and rimmed vacuoles (yellow arrow) (×400). (D) Electron microscopy—varying degrees of disorganization of myofibrils with loss of their normal striation pattern and nemaline rods (X 37,500) (orange arrow).

