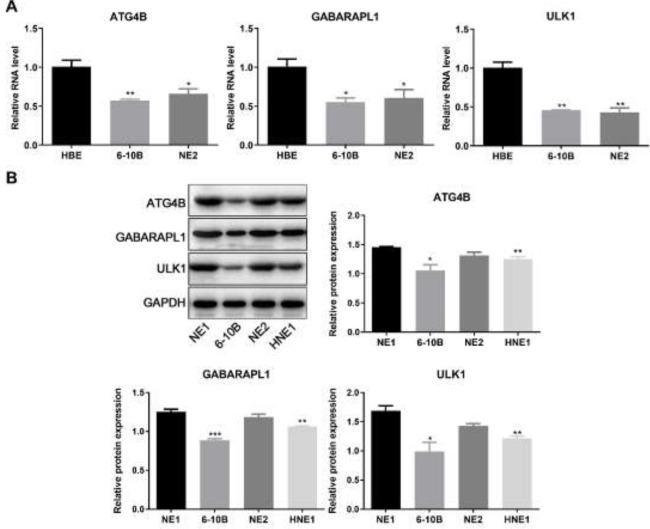
Figure 1.
Levels of ATG4B and GABARAPL1 in NPC cell lines
A. Relative mRNA levels of ATG4B, GABARAPL1, and ULK1 in different NPC cell lines (HBE, 6-10B, and NE2). B. Western blot analysis of ATG4B, GABARAPL1, and ULK1 expression in different NPC cell lines (NE1, 6-10B, NE2, and HNE1). Grayscale analysis of western blot indicates protein expression levels relative to GAPDH. Biological triplicates were performed. Data are presented as mean ± SD. Ordinary one-way ANOVA and multiple comparisons were used for analysis. ***P<0.001, **P<0.01, *P<0.05.
ATG4B: autophagy-related 4B cysteine peptidase; GABARAPL1: gamma-aminobutyric acid (GABA) type A receptor-associated protein-like 1; NPC: nasopharyngeal carcinoma; ULK1: Unc-51 like autophagy activating kinase 1; GAPDH: glyceraldehyde 3-phosphate dehydrogenase; SD: standard deviation; ANOVA: analysis of variance

