Figure 5.
Effect of GABARAPL1 on HIF-2a via autophagy
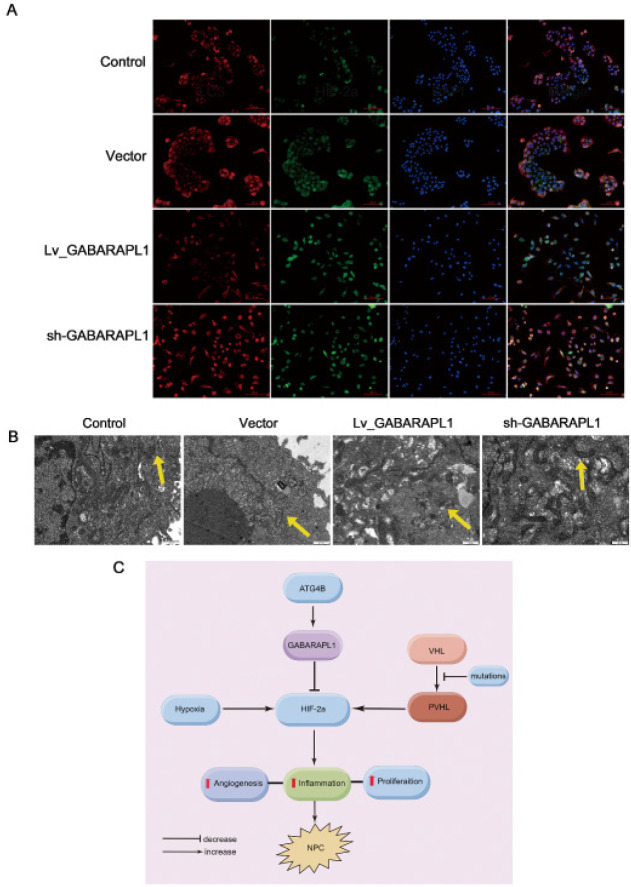
A. Representative immunofluorescence staining on 6-10B cells after knockdown or overexpressed GABARAPL1. Colocalization of HIF-2α and LC3 is shown. Scale bar: 100 µm. Red indicates LC3. Green indicates HIF-2α. Blueindicates DAPI. Yellow indicates colocalization of HIF-2α and LC3. B. Representative images of autophagosome formation after knockdown or overexpressed GABARAPL1 under a transmission electron microscope. Yellow arrows indicate autophagosomes. Compared to the control, empty vector, and GABARAPL1 knockdown cells, the autophagosome formation is increased in cells with overexpression of GABARAPL1. Scale bar: 500 µm. C. Mechanistic schematics of regulatory pathways. The cascade regulations of ATG4B, GABARAPL1, and HIF-2a in NPC cells are shown. Control, cells without interventions. Vector, cells transfected with empty vector. Lv_GABARAPL1, cells with overexpressed GABARAPL1. Sh_GABARAPL1, cells with knockdown of GABARAPL1.
GABARAPL1: gamma-aminobutyric acid (GABA) type A receptor-associated protein-like 1; HIF-2α: hypoxia-inducible factor 2 alpha; LC3: microtubule-associated protein 1 light chain 3; DAPI: 4’,6-diamidino-2-phenylindole; ATG4B: autophagy-related 4B cysteine peptidase; NPC: nasopharyngeal carcinoma

