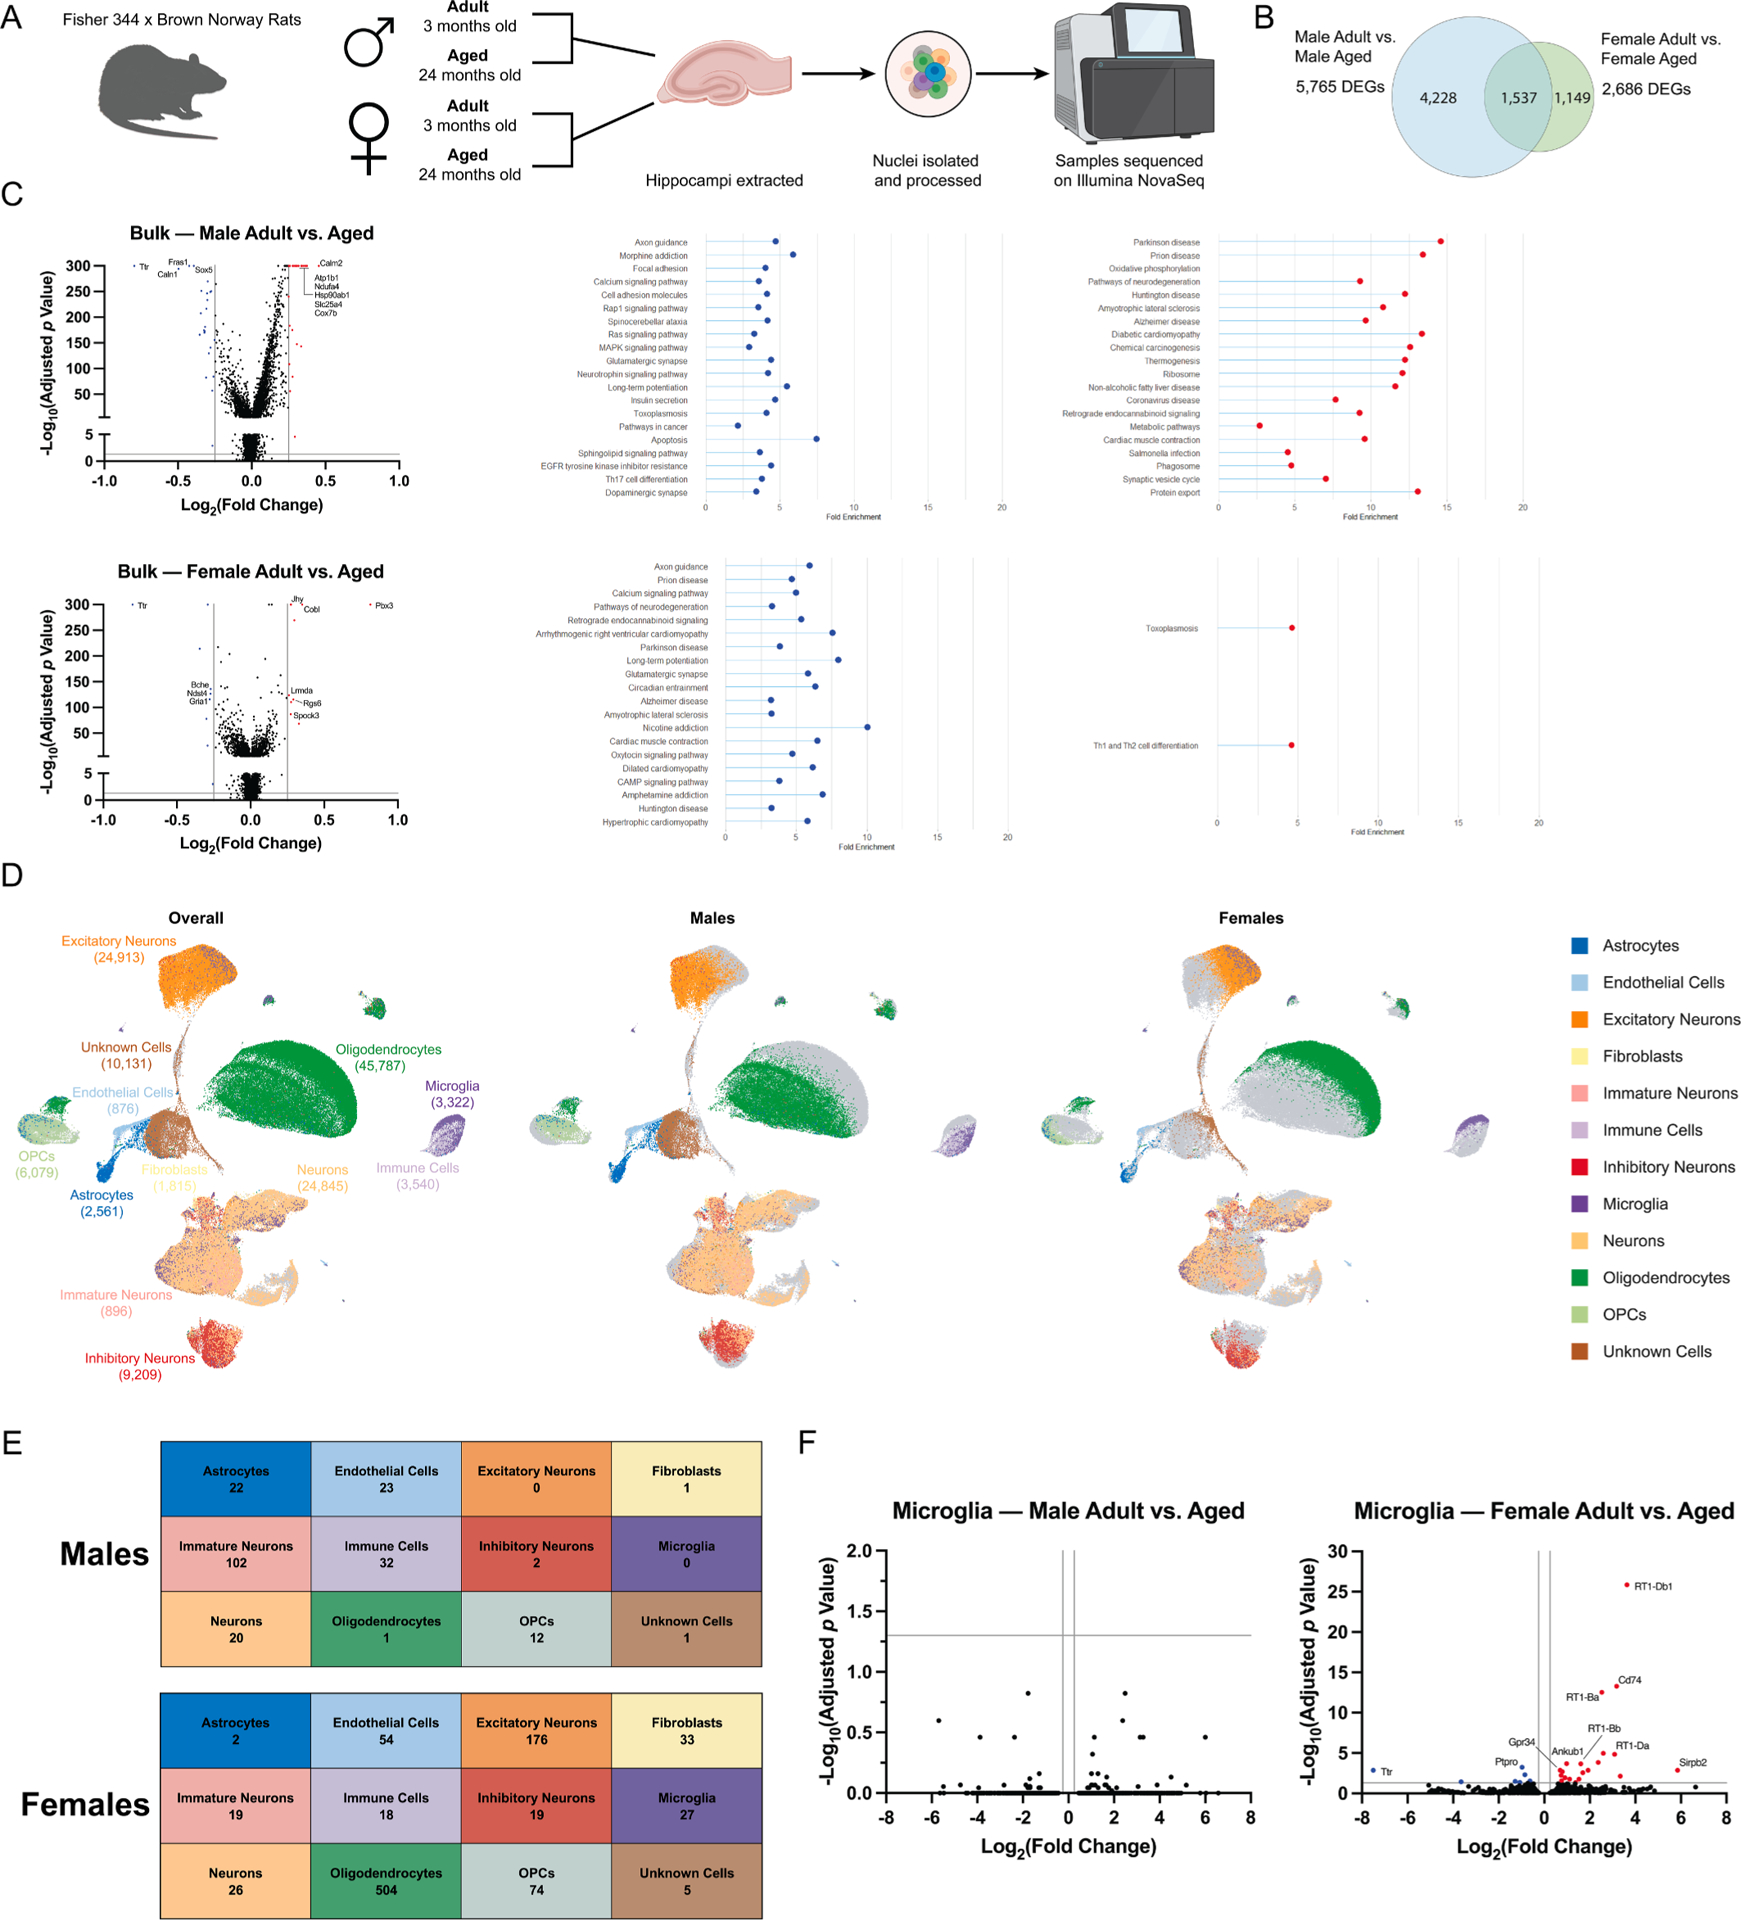
Fig. 6.

Sexual dimorphism in age-dependent changes in the hippocampal transcriptome. a) Experimental protocol. Schematic created with Biorender.com. b) Venn diagram of differentially expressed genes identified from bulk sequencing of hippocampi from adult and aged male (left) and female (right) rats. c) Volcano plots and KEGG analysis of bulk sequencing of hippocampi from adult and aged male (top) and female (bottom) rats. The top 20 significantly enriched pathways are displayed for each sex: red – upregulated pathways, blue – downregulated pathways. d) UMAP analysis of single cell sequencing to identify cell populations (left) and compare adult vs aged males (center) and adult vs aged females (right). e) Summary of differentially-expressed genes in cell populations from males (top) and females (bottom). f) Volcano plots of differentially-expressed genes in microglia from adult and aged male (left) and female (right) rats.
