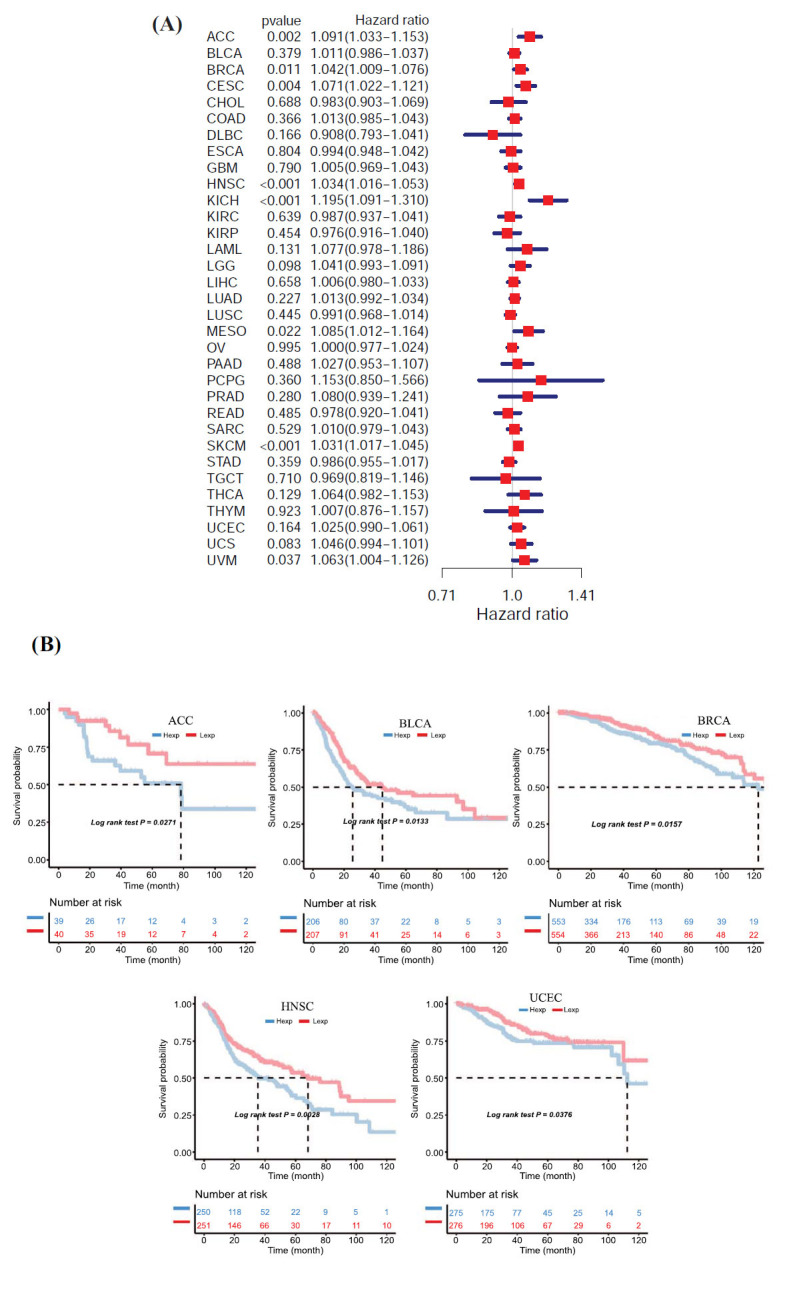
Fig. (2).

AIMP2 expression correlates with overall survival time (OS). (A) Forest plots showing correlations between OS and AIMP2 expression across 33 cancer types. (B) Kaplan-Meier analyses of the association between AIMP2 expression and OS in ACC, BLCA, BRCA, HNSC, and UCEC, respectively. (Hexp: high expression; Lexp: low expression).
