FIGURE 1.

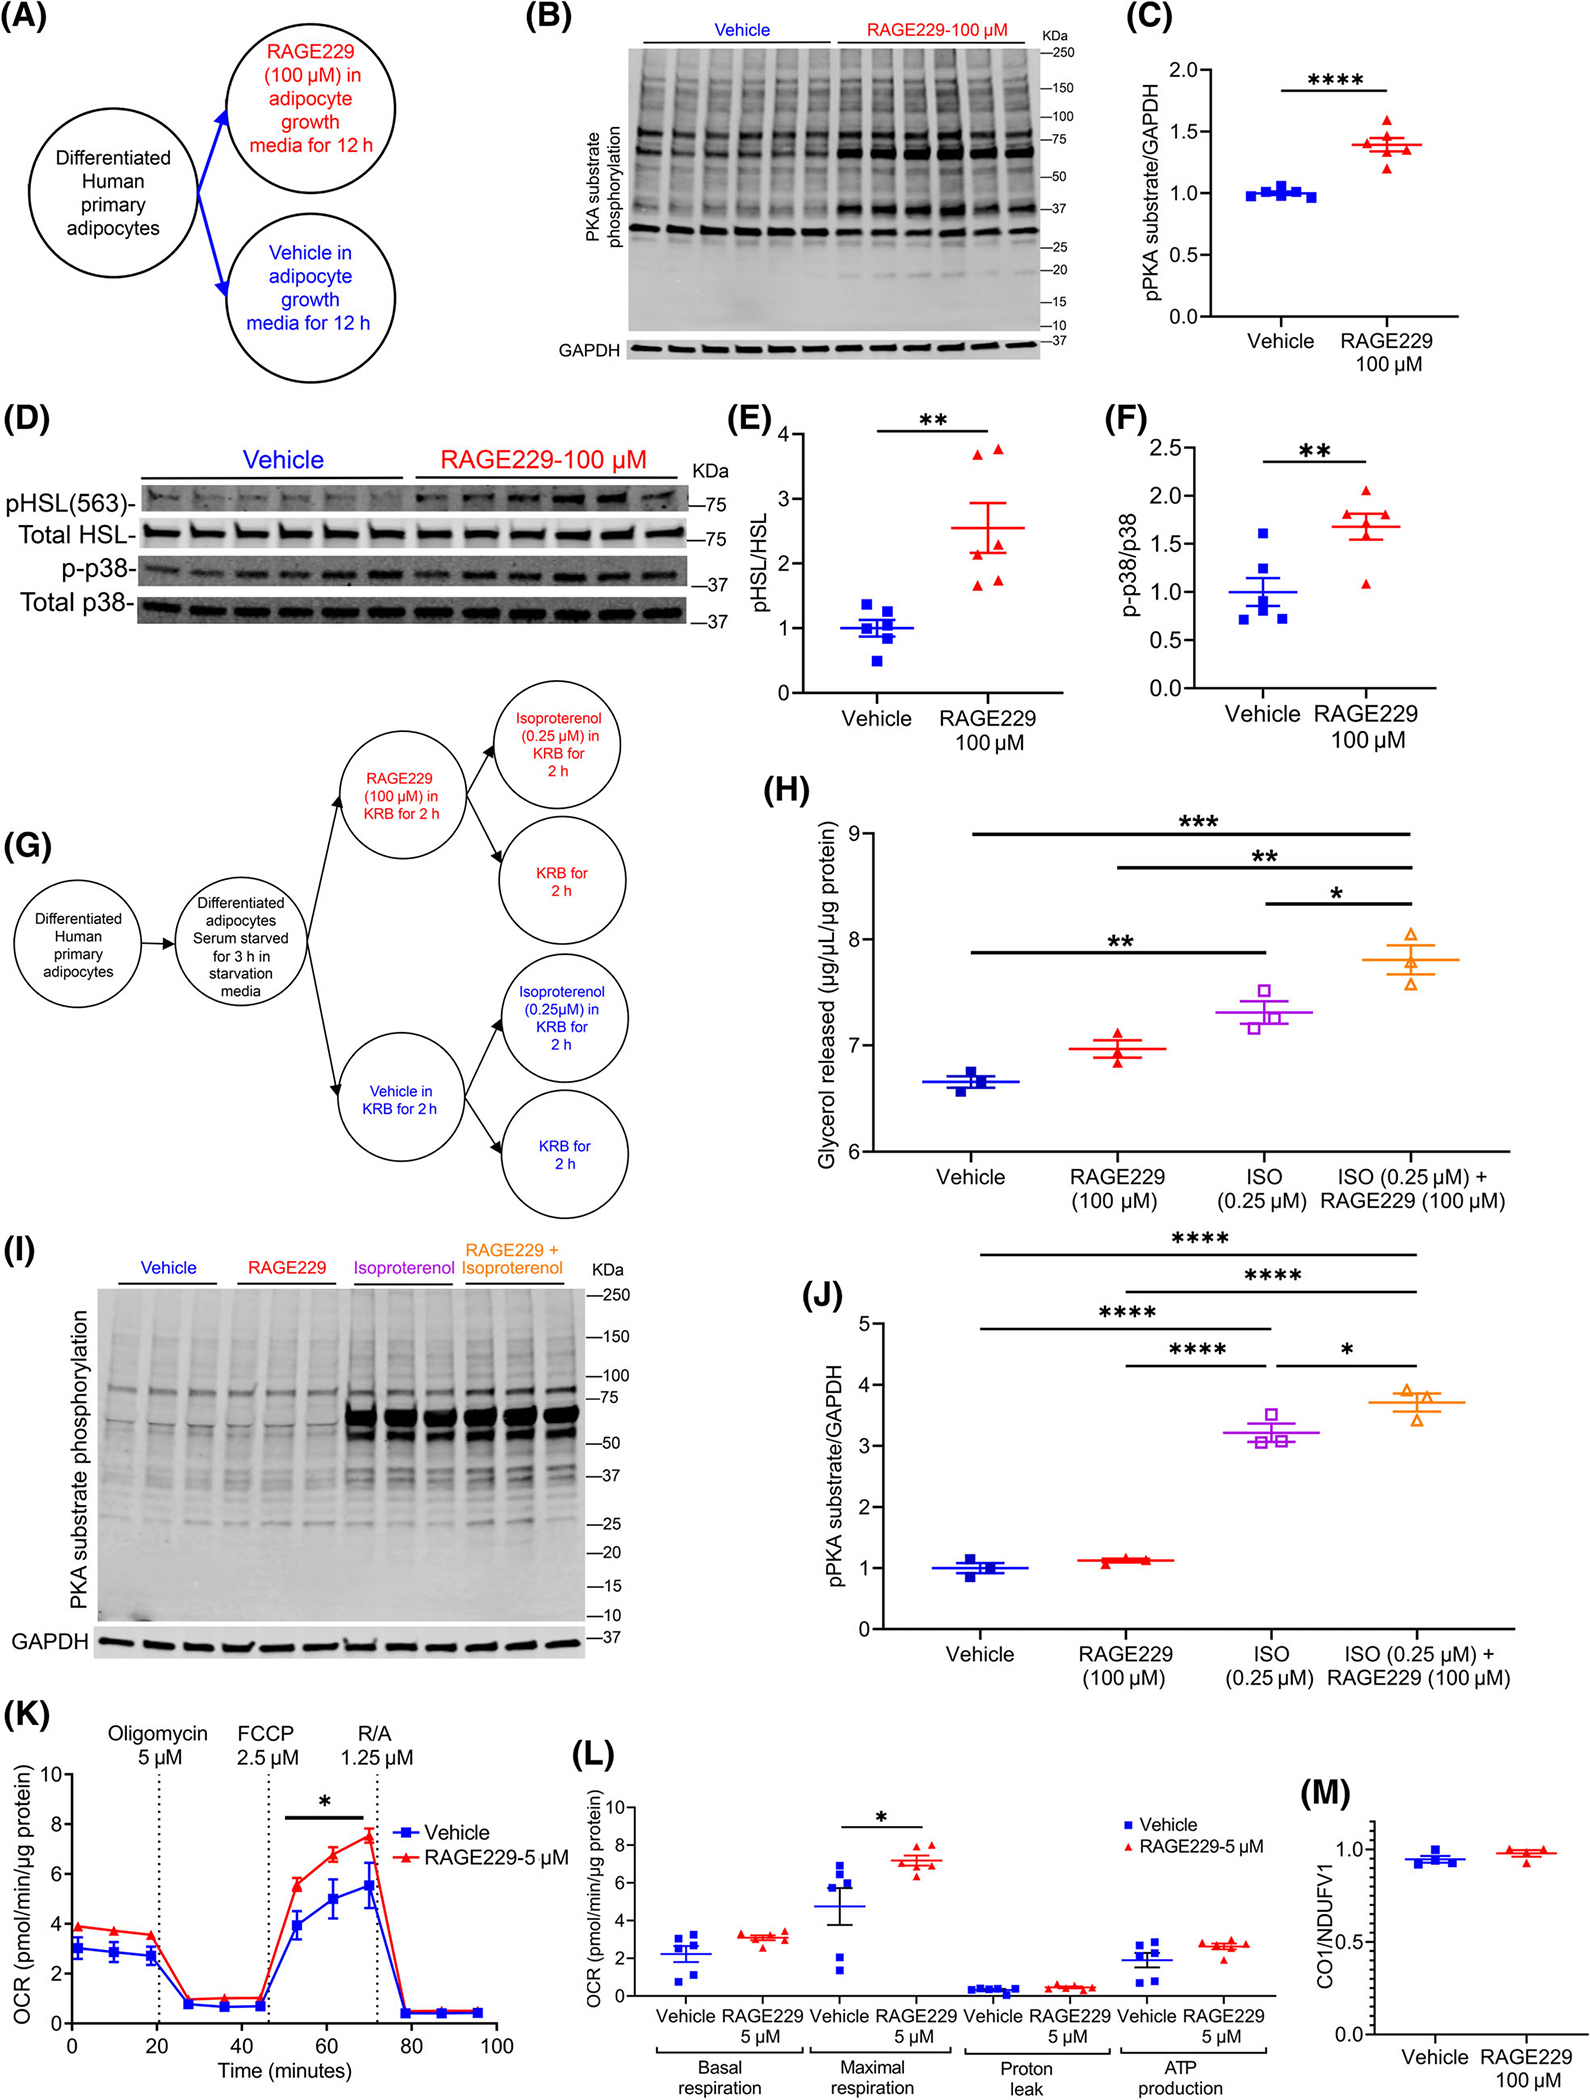
Treatment of human adipocytes with RAGE229 increases PKA-substrate phosphorylation, β-adrenergic-stimulated lipolysis, and mitochondrial function. (A) Experimental schematic: differentiated human subcutaneous adipose tissue-derived adipocytes treated with RAGE229 (100 μM) or vehicle (DMSO) in growth media for 12 hours (n = 6 independent wells of the tissue culture plate per treatment group; data presented from one of the two independent experiments; each independent experiment contained a total of n = 6 independent replicates per treatment group). (B–F) Western blot analysis of cell lysate probed for expression of PKA-substrate phosphorylation/glyceraldehyde-3-phosphate dehydrogenase (GAPDH), phosphorylated HSL-serine 563/total HSL, and phosphorylated p38/total p38 MAPK. (G) Experimental schematic: differentiated human adipocytes as in panel A were serum-starved for 3 hours before treatment with either RAGE229 (100 μM) or vehicle (DMSO) for 2 hours followed by isoproterenol (ISO; 0.25 μM) treatment for 2 hours (n = 3 independent wells of the tissue culture plate per treatment group; data presented from one of the two independent experiments; each independent experiment contained a total of n = 3 independent replicates per treatment group). (H) Glycerol released into KRB after ISO treatment. (I–J) Western blot analysis of cell lysate for expression of PKA-substrate phosphorylation/GAPDH. (K,L) OCR measured in adipocytes pretreated with vehicle vs. RAGE229 (5 μM) for 2 hours (n = 6 independent wells of the plate per treatment group; data presented from one of the two independent experiments; each independent experiment contained a total of n = 6 independent replicates per treatment group). (M) Mitochondrial DNA content presented as the ratio of CO1/NDUFV1 in adipocytes pretreated with vehicle vs. RAGE229 (5 μM) for 2 hours (n = 4 independent experimental wells of the tissue culture plate per treatment group). Data are presented as the mean ± SEM. For group comparison, the Shapiro–Wilk normality test was conducted first for each group with prespecified significance level of 0.1, and if passed, the t test was implemented whereas the nonparametric Wilcoxon rank sum test was used if normality was not established. Linear mixed-effect model was adopted for correlated/time-series data with post hoc t test for group comparisons at each time point. For panels H and J, two-way ANOVA followed by multiple comparison without correction was used to compare groups. KRB, Kreb’s Ringer Bicarbonate buffer; OCR, oxygen consumption rate; RAGE229, receptor for advanced glycation end products; R/A, rotenone / antimycin A; CO1, cytochrome C oxidase subunit 1; NDUFV1, NADH:ubiquinone oxidoreductase core subunit V1. *p < 0.05; **p < 0.01; ***p < 0.001; ****p < 0.0001 [Color figure can be viewed at wileyonlinelibrary.com]
