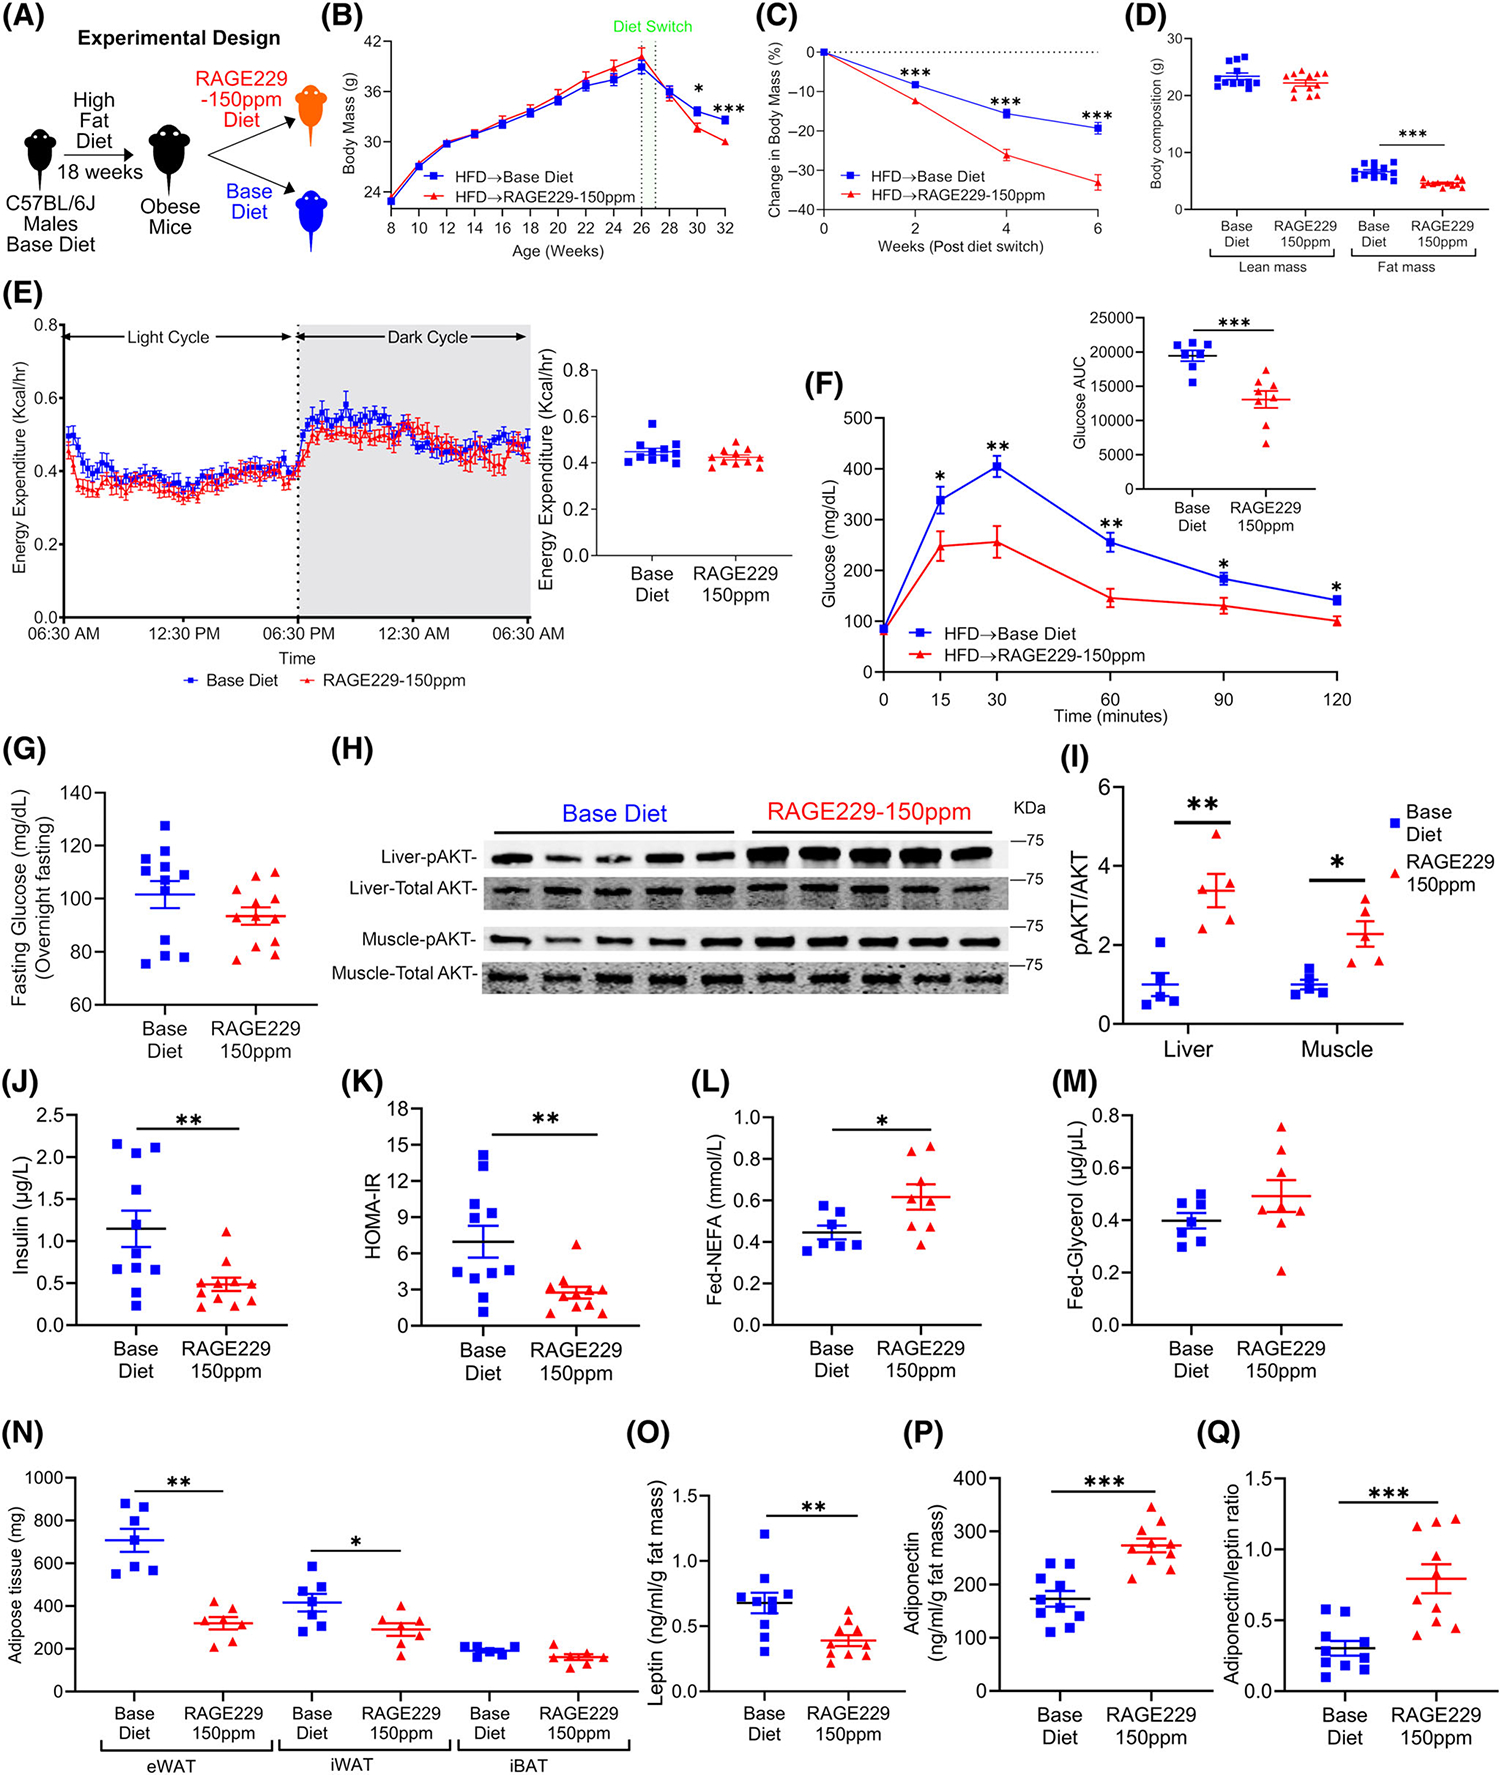
FIGURE 7.

Administration of RAGE229–150 ppm diet enhances loss of body mass and adiposity and improves metabolic health in male mice with established obesity undergoing weight loss. (A) Experimental schematic. (B) Body mass recorded over the indicated time course in male mice fed HFD between age 8 and 26 weeks to establish obesity; mice were then switched to base diet (n = 38) or RAGE229–150 ppm diet (n = 40). (C) Change in body mass (%) over 6 weeks after diet switch. (D) Lean mass and fat mass measured at 9 weeks after diet switch by DXA (n = 12 per group). (E) Energy expenditure of mice switched from HFD to base diet (n = 11) or RAGE229–150 ppm diet (n = 11) measured at 10 weeks after diet switch. (F) Post-overnight fasting glucose tolerance test in mice with obesity at 6 weeks after diet switch to either base diet (n = 7) or RAGE229–150 ppm diet (n = 8). (G) Post-overnight fasting plasma glucose (n = 12 per group) at 12 weeks after diet switch. (H,I) Western blot of liver and muscle tissue collected 15 minutes after intraperitoneal injection of insulin bolus and then probed for expression of phosphorylated Protein Kinase B AKT-serine 473/total AKT (n = 5 per group). (J,K) Post-overnight fasting plasma insulin and HOMA-IR at 12 weeks after diet switch (n = 11 per group). (L,M) Randomly fed plasma NEFA and glycerol at 12 weeks after diet switch to either base diet (n = 7) or RAGE229–150 ppm diet (n = 8). (N) Adipose tissue depot mass collected from randomly fed mice 12 weeks after diet switch (n = 7 base diet, n = 6–7 RAGE229–150 ppm diet). (O–Q) Post-overnight fasting plasma leptin/fat mass, adiponectin/fat mass, and adiponectin/leptin ratio at 12 weeks after diet switch (n = 10 per group). Data are presented as the mean ± SEM. Data presented in panels B and C are combined from four independent cohorts. Multiple cohorts were employed for replication and in order to execute all of the biochemical, molecular, and physiological studies reported in this figure. For analysis of absolute body mass (panel B) over the indicated time period, piecewise linear mixed-effect model was fitted, with node set at 26 weeks, and difference was tested between the body mass of the weight of base diet and RAGE229–150 ppm diet groups after diet switch. Linear mixed-effect model was adopted for correlated/time-series data (B,C,F) with post hoc t test for group comparisons at each time point. For group comparison, the Shapiro–Wilk normality test was conducted first for each group, with prespecified significance level of 0.1, and if passed, the t test was implemented whereas the nonparametric Kruskal-Wallis test/Wilcoxon rank sum test was used if normality was not established. AUC, area under the curve; DXA, dual-energy x-ray absorptiometry; HFD, high-fat diet; HOMA-IR, homeostatic model assessment of insulin resistance; RAGE229, receptor for advanced glycation end products. *p < 0.05; **p < 0.01; ***p < 0.001 [Color figure can be viewed at wileyonlinelibrary.com]
