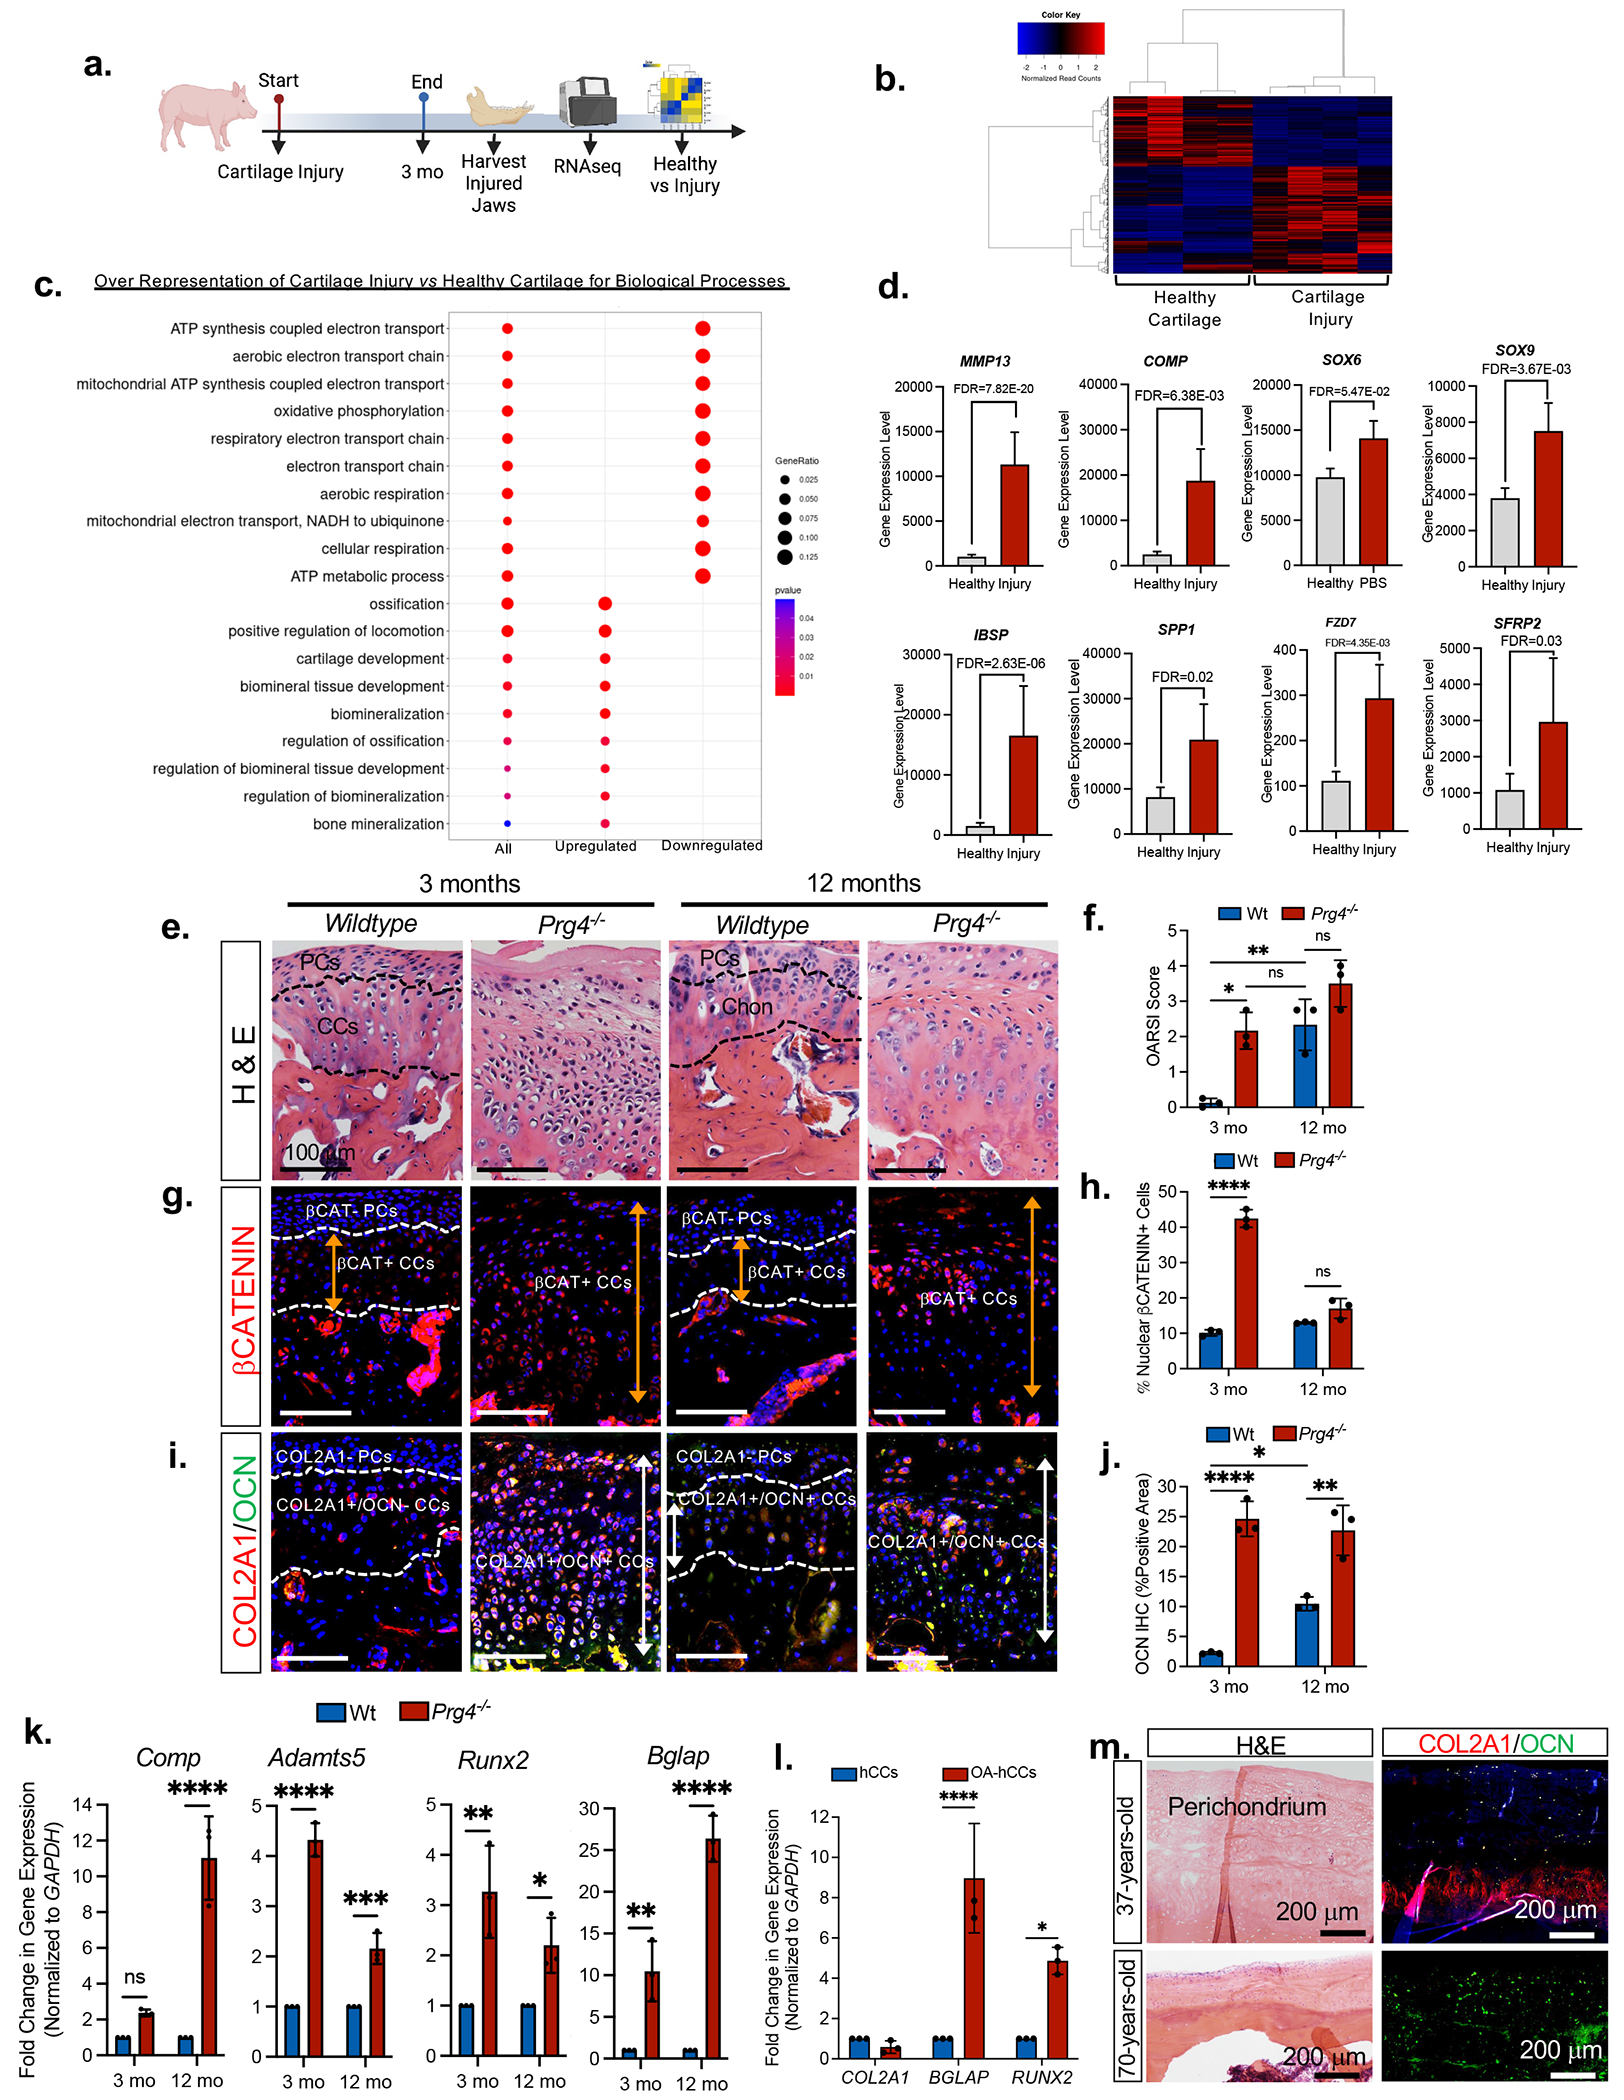
Figure 1. Osteoarthritic chondrocytes are phenotypically unstable and have high Wnt/β–CATENIN.

(a) Schematic depicting miniature pig cartilage injury model. (b) Gene expression heat map and hierarchical clustering for 993 genes significantly up- or downregulated (FC > ±2, FDR-adjusted p value=0.05) in injured cartilage (versus healthy). (c) Dot plot of GO terms of biological processes from B. (d) Relative gene expression levels from GO enrichment analyses. (e) H&E staining and (f) OARSI scores of Wildtype and Prg4−/− mice. Data presented are mean score from 3 reviewers ± SD. *p≤0.05, **p≤0.01; Two-way ANOVA followed by Tukey’s post hoc; n=3 mice. (g) Immunohistochemistry of βCatenin expression in Wildtype and Prg4−/− mice. PCs=perichondrial cells, CCs=condylar chondrocytes (h) Percentage of nuclear β-CATENIN-expressing cells in Wildtype and Prg4−/− mice. Data are mean percentage ± SD normalized to total cell number; ***p≤0.001; Two-way ANOVA followed by Tukey’s post hoc; n=3 mice. (i) Representative image of immunohistochemistry of type II collagen (COL2A1) and osteocalcin (OCN) in Wildtype and Prg4−/− mice. (j) Area of OCN expression from immunohistochemistry in Wildtype and Prg4−/− mice. Data are mean % area ± SD normalized to total area; *p≤0.05; **p≤0.01; ****p≤0.0001; Two-way ANOVA followed by Tukey’s post hoc; n=3 mice. (k) qRT-PCR using Wildtype and Prg4−/− mouse condyles. Data presented are mean fold change ± SD normalized to GAPDH. *p≤0.05, **p≤0.01, ***p≤0.001, ****p≤0.0001; two-way ANOVA followed by Tukey’s post hoc; n=3 mice. (l) qRT-PCR using healthy human mandibular condylar chondrocytes (hMCCs) relative to osteoarthritic human mandibular condylar chondrocytes (OA-hMCCs). Data are mean fold change ± SD normalized to GAPDH. *p≤0.05, ***p≤0.001; two-way ANOVA followed by Tukey’s post hoc; n=3 experiments. (m) H&E and immunohistochemistry of type II collage (COL2A1) and osteocalcin (OCN) in the mandibular condylar cartilages of a healthy 37-year-old and a 70-year-old OA patient .
