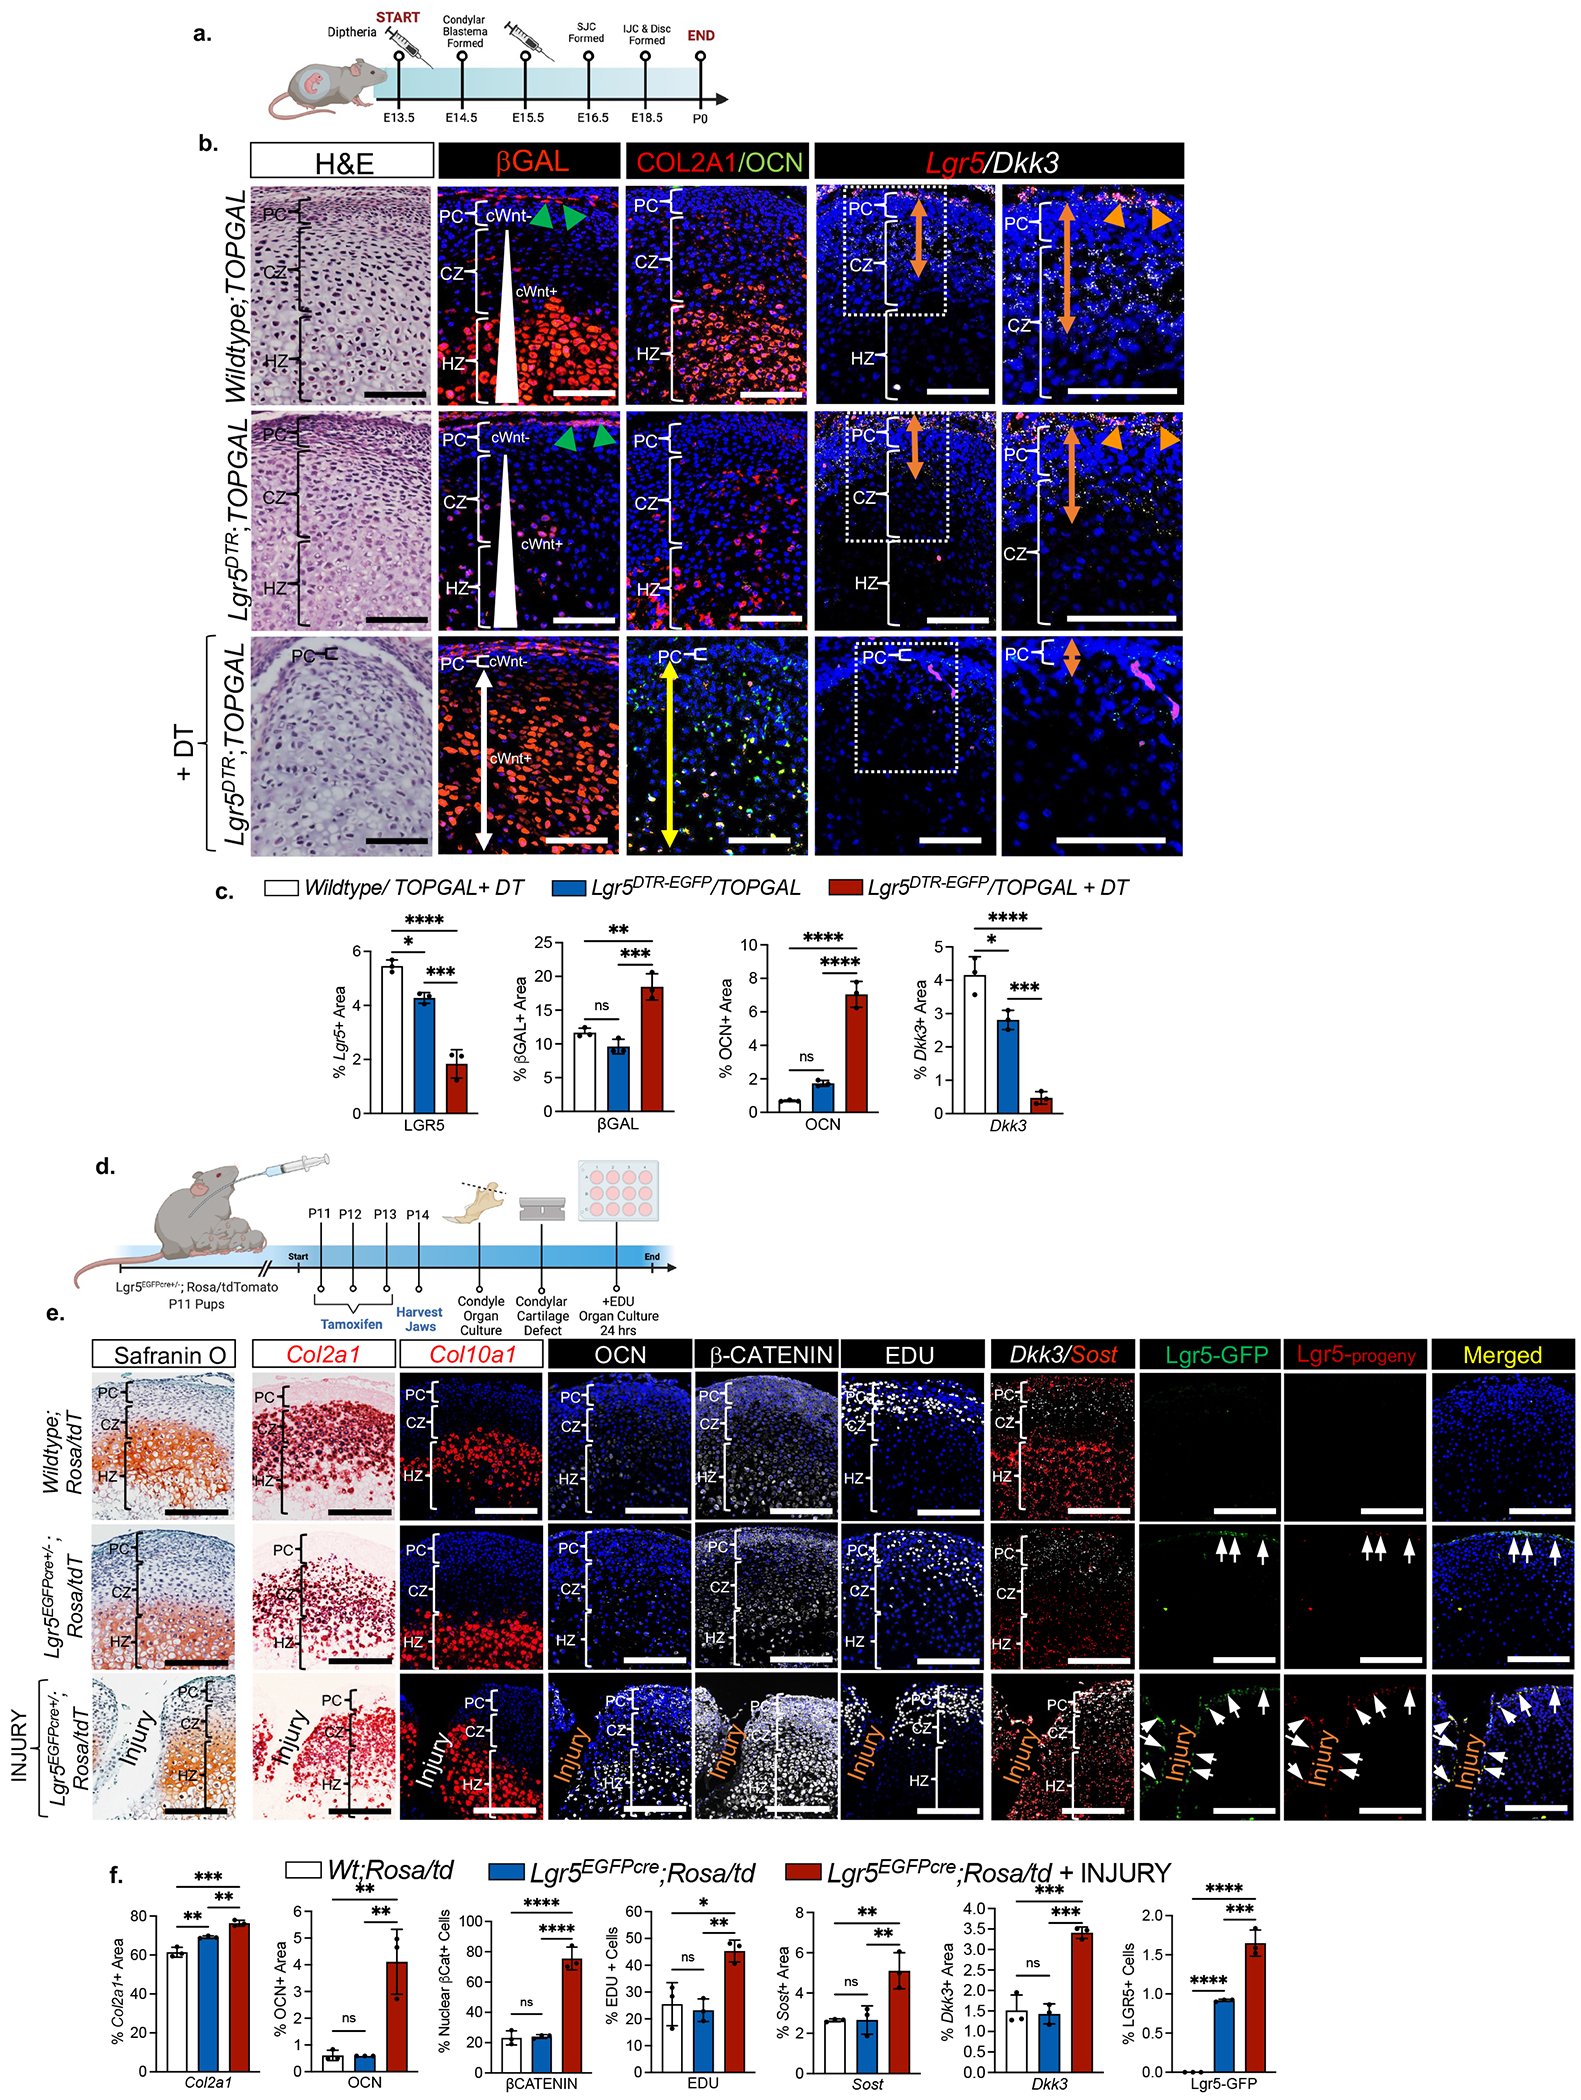
Figure 4. Lar5-expressing cells provide a Wnt inhibitory niche critical for maintaining chondroprogenitor cell pool and chondrocyte phenotypic identity.

(a) Experimental timeline of Lgr5 ablation. (b) H&E staining, immunohistochemistry of βgalactosidase (βgal), type II collagen (COL2A1) and osteocalcin (OCN), and in situ hybridization of Lgr5 and Dkk3 in P0 mice from experiment in 4a. PC=perichondrium, CZ=chondrocyte zone, HZ=hypertrophic zone. Green triangles=cWnt-activated superficial zone cells in perichondrium, white triangle = cWnt gradient, white arrow=cWnt activated cells, yellow arrow=area of OCN expression, orange arrow = area of Dkk3 expression, orange triangles= Lgr5/Dkk3-expressing cells. (c) Quantification of immunohistochemistry and in situ hybridization from 4b. Data are mean % area expression ± SD normalized to total area; *p≤0.05, **p≤0.01, ***p≤0.001, ****p≤0.0001; one-way ANOVA followed by Tukey’s post hoc; n=3 mice. (d) Schematic of cartilage injury model using organ cultures. (e) Safranin O staining, in situ hybridization of Col2a1, Col10a1, Dkk3, and Sost, immunohistochemistry of osteocalcin (OCN) and βCatenin, EDU uptake, and Lgr5-GFP+ cells (green) and Lgr5-progeny (red) in mice from experiment in 4d. Quantification of immunohistochemistry, in situ hybridization, EDU+ cells, and Lgr5-GFP+ cells from experiment in 4d. Data are mean % area expression ± SD normalized to total area; **p≤0.01, ***p≤0.001, ****p≤0.0001; one-way ANOVA followed by Tukey’s post hoc; n=3 mice.
