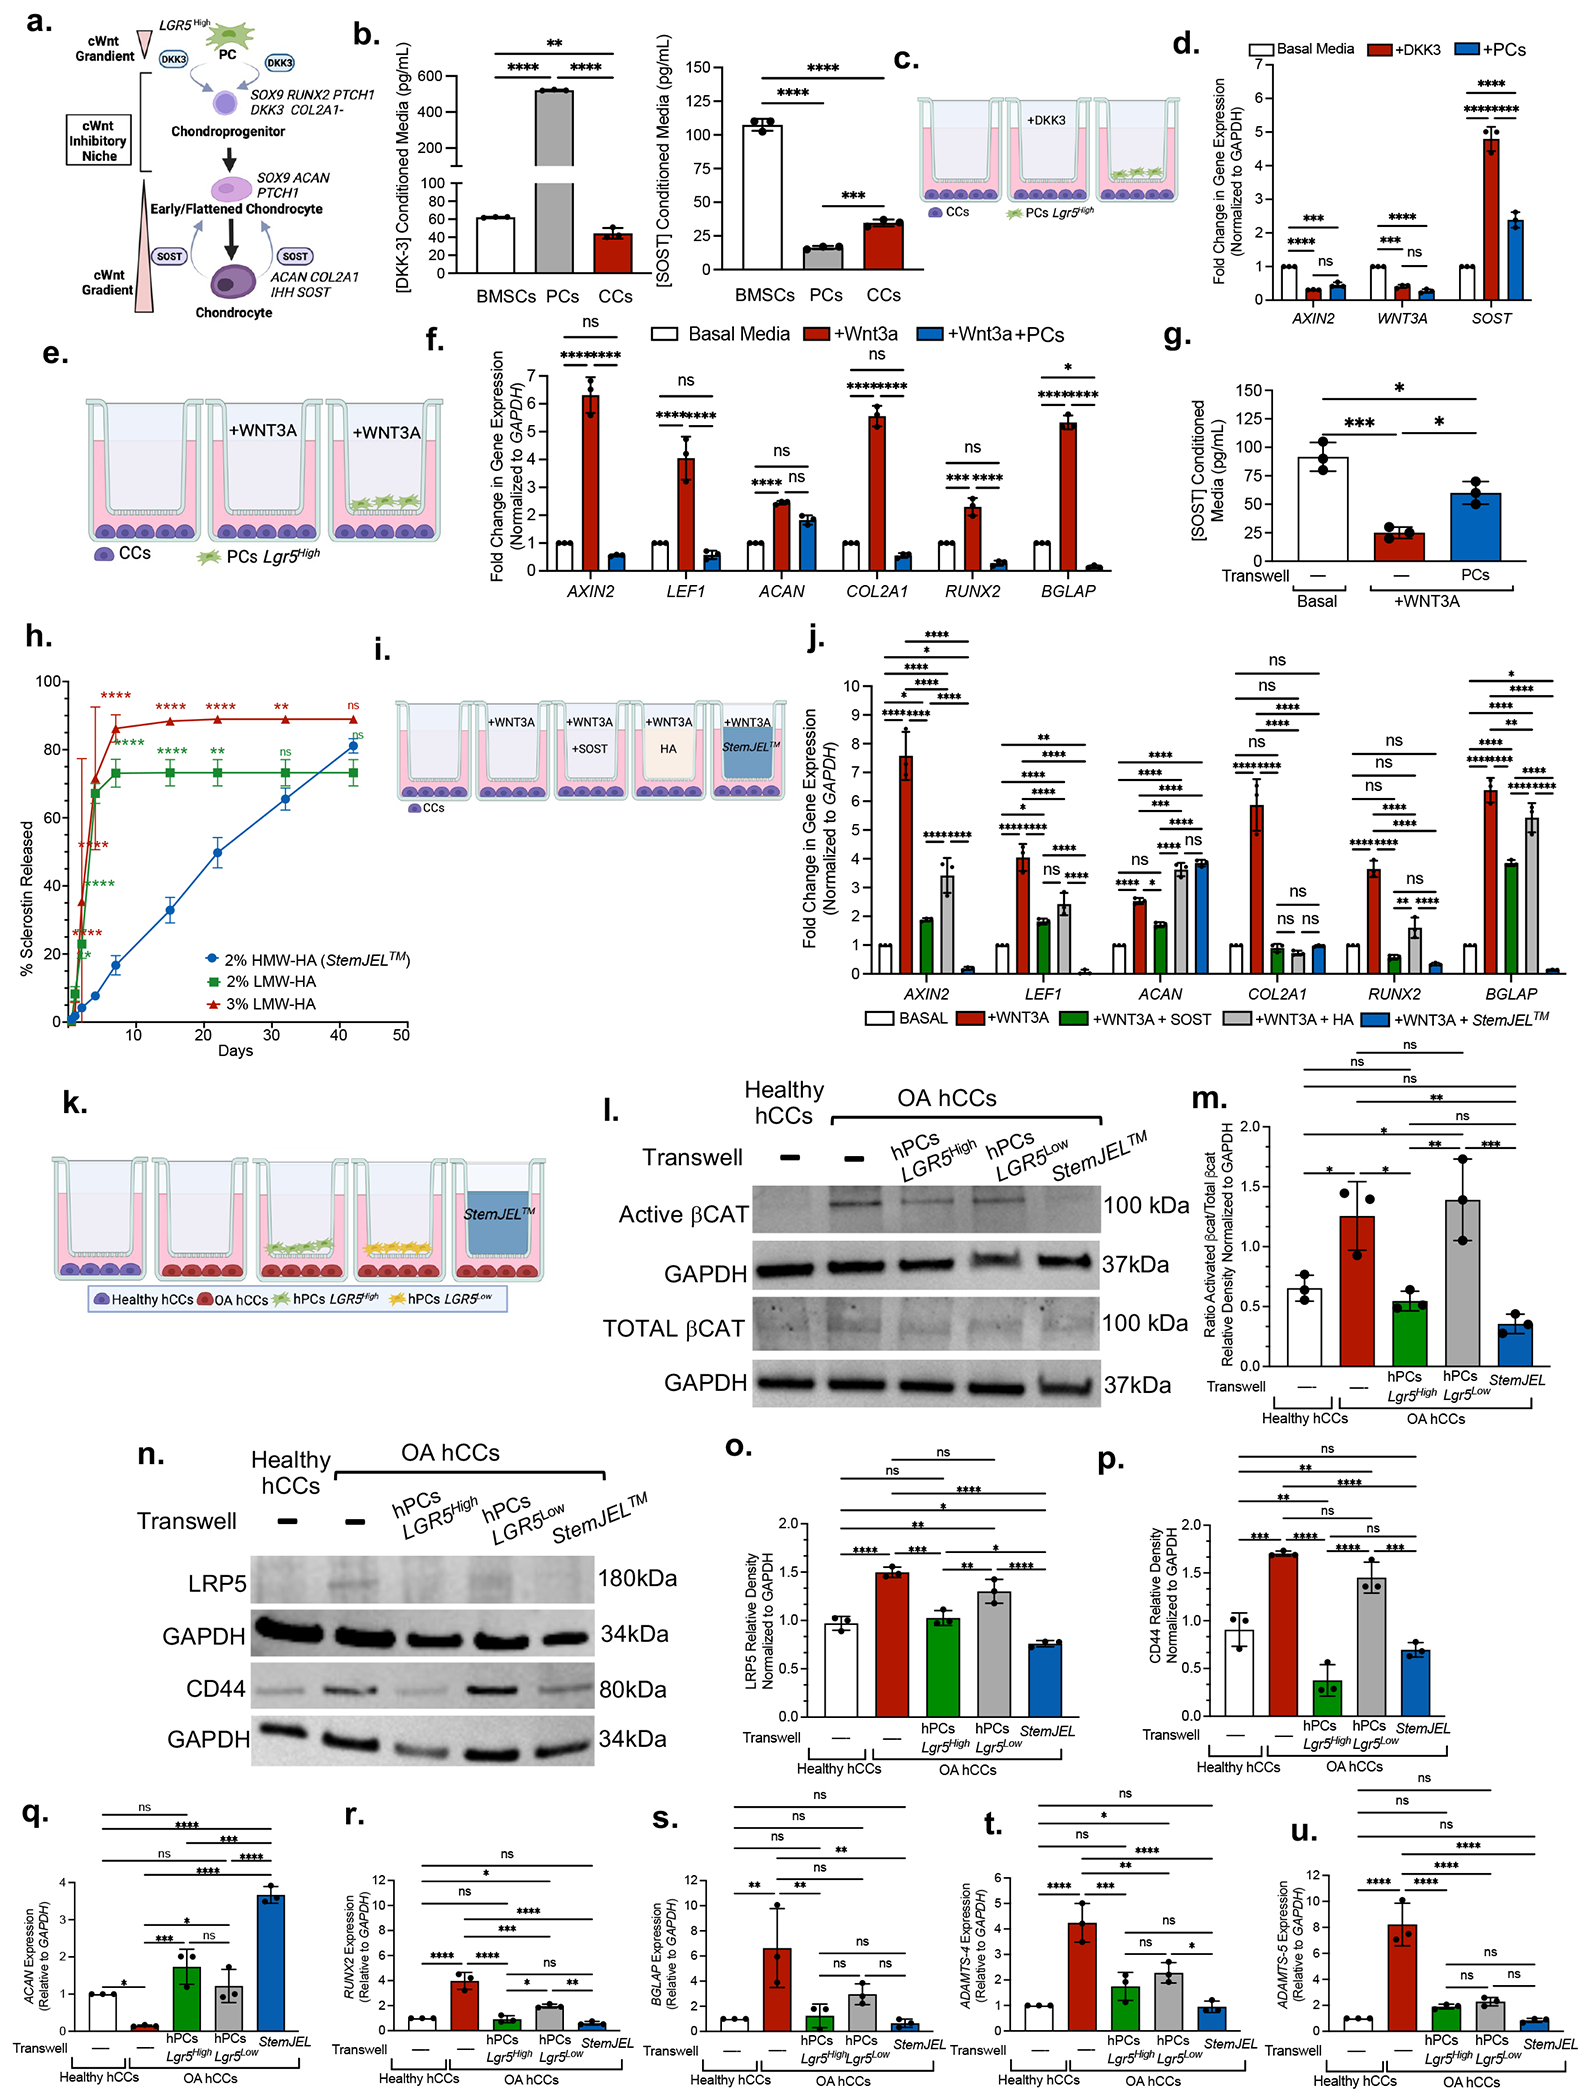
Figure 5. StemJEL™ recapitulates the Wnt inhibitory niche in cartilage and rescues chondrocyte phenotypic identity.

(a) Schematic model. (b) ELISA using conditioned media from mini-pig-derived cells. Data are mean protein concentration ± SD. **p≤0.01, ***p≤0.001, ****p≤0.0001; one-way ANOVA followed by Tukey’s post hoc; n=3 experiments. (c) Experimental schematic in d. (d) qRT-PCR of CCs from c. Data presented are mean fold change ± SD normalized to GAPDH. ***p≤0.001, ****p≤0.0001; two-way ANOVA followed by Tukey’s post hoc; n=3 experiments. (e) Experimental schematic in f-g. (f) qRT-PCR of CCs in e. Data are mean fold change ± SD normalized to GAPDH; *p≤0.05, **p≤0.01, ***p≤0.001, ****p≤0.0001; two-way ANOVA followed by Tukey’s post hoc; n=3 experiments. (g) ELISA using conditioned media in e. Data presented are mean ± SD. *p≤0.05, ***p≤0.001; one-way ANOVA followed by Tukey’s post hoc; n=3 experiments. (h) SOST release curve. Data are mean ± SD; *p≤0.05 **p≤0.01; ***p≤0.001; ****p≤0.0001 relative to Day 0, two-way ANOVA followed by Tukey’s post hoc; n=3 experiments. (i) Experimental schematic in j. (j) qRT-PCR of CCs in i. Data are mean fold change ± SD normalized to GAPDH; *p≤0.05, **p≤0.01, ***p≤0.001, ****p≤0.0001; two-way ANOVA followed by Tukey’s post hoc; n=3 experiments. (k) Experimental schematic of l-u (I) Western blot analyses in k. (m) Quantification of westerns in k-l. Data are mean ± SD normalized to GAPDH; *p≤0.05, **p≤0.01, ***p≤0.001; one-way ANOVA followed by Tukey’s post hoc; n=3 experiments. (n) Western blot in k. (o,p) Quantification of western blots n. Data presented are mean ± SD normalized to GAPDH; *p≤0.05, **p≤0.01, ***p≤0.001; one-way ANOVA followed by Tukey’s post hoc; n=3 experiments. (q-u) qRT-PCR of OA hCCs in k. Data are mean fold change ± SD normalized to GAPDH; *p≤0.05, **p≤0.01, ***p≤0.001, ****p≤0.0001; one-way ANOVA followed by Tukey’s post hoc; n=3 experiments.
