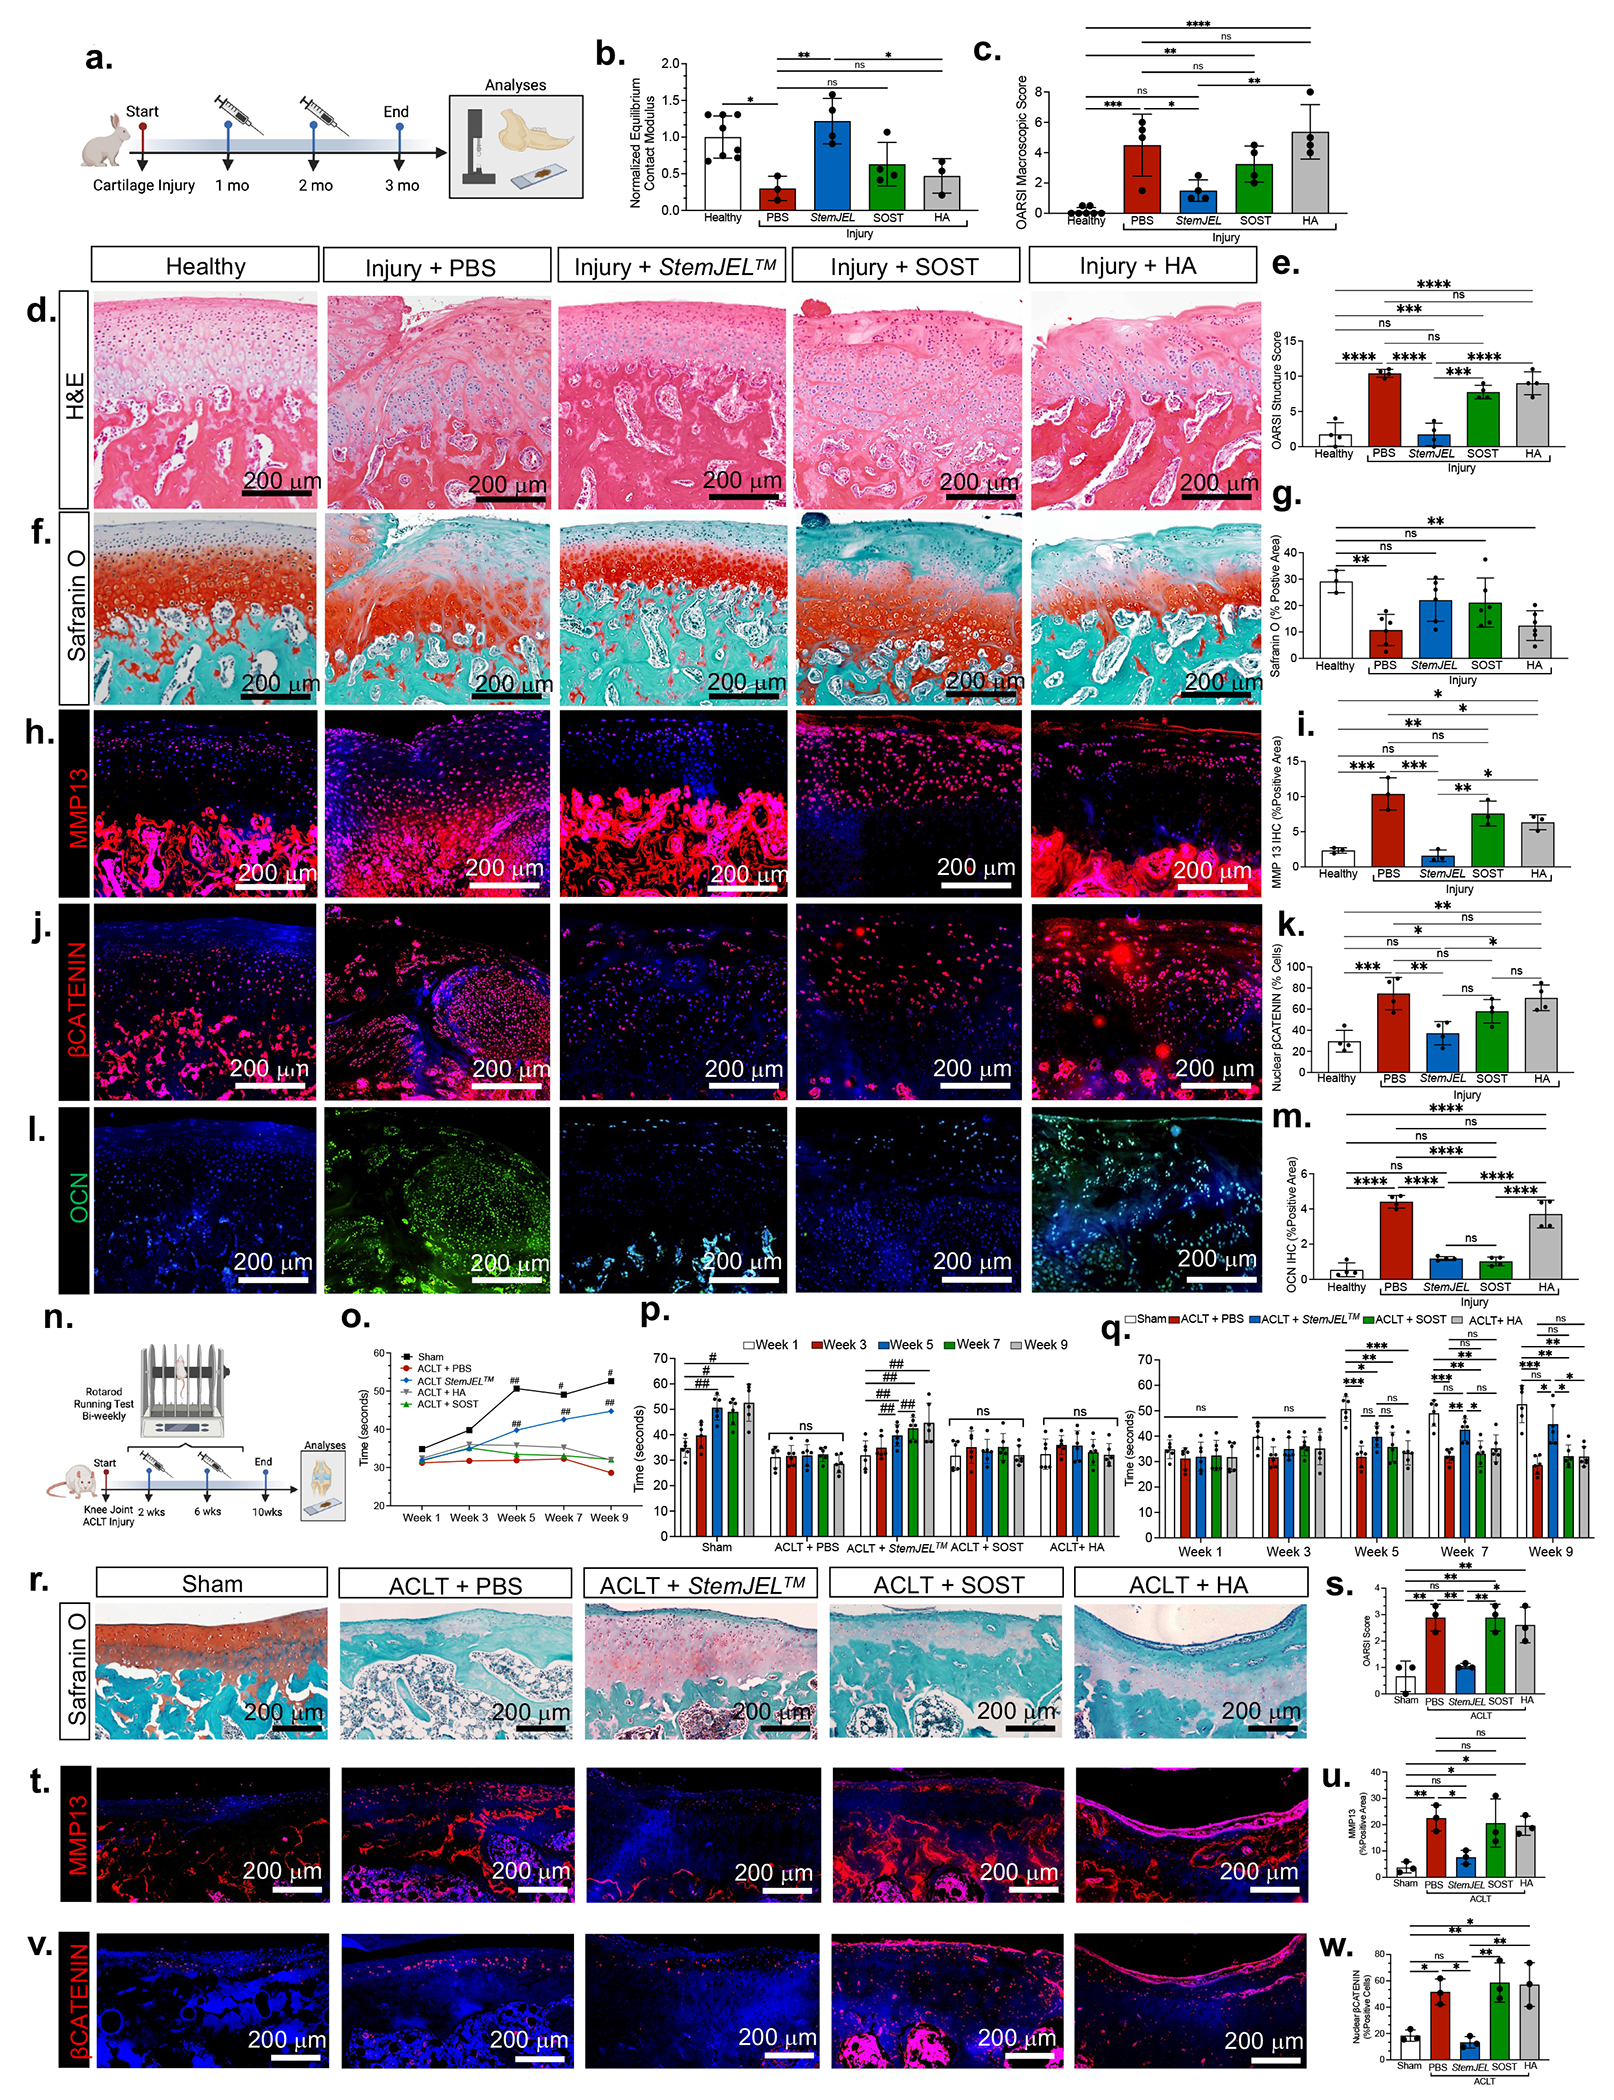
Figure 6. StemJEL™ ameliorates post-traumatic osteoarthritis and restores chondrocyte identity in rabbit temporomandibular joints and rat knee joints.

(a) Schematic of rabbit TMJ injury model. (b) Normalized equilibrium contact modulus in rabbit condyles in a. Data are normalized mean ± SD; *p≤0.05, **p≤0.01; one-way ANOVA followed by Tukey’s post hoc; n=3-8 rabbits. (c) OARSI macroscopic score of rabbits a. Data are mean ± SD; **p≤0.01, ***p≤0.001; one-way ANOVA followed by Tukey’s post hoc; n=3-8 rabbits. (d) H&E of rabbits in a. (e) OARSI structure score of rabbit condyles in a. Data are mean ± SD; ***p≤0.001, ****p≤0.0001; one-way ANOVA followed by Tukey’s post hoc; n=4 rabbits. (f) Safranin O of rabbit condyles in a. (g). Quantification of safranin O staining in f. Data are mean ± SD; **p≤0.01; one-way ANOVA followed by Tukey’s post hoc; n=3-6 rabbits. (h) Immunostaining of MMP13 in rabbits from a. (i) Area of MMP13 immunostaining in h. Data are mean ± SD; *p≤0.05, **p≤0.01, ***p≤0.001; one-way ANOVA followed by Tukey’s post hoc; n=3 rabbits. (j) Immunostaining of βCATENIN in rabbits from a. (k) Percentage of nuclear βCatenin+ cells j. Data are mean percent nuclear βCATENIN+ cells ± SD; *p≤0.05, **p≤0.01, ***p≤0.001; one-way ANOVA followed by Tukey’s post hoc; n=4 rabbits. (l) Immunohistochemistry of osteocalcin (OCN) in rabbits from a. (m) The area of OCN immunostaining in I. Data are mean area ± SD; ****p≤0.0001; one-way ANOVA followed by Tukey’s post hoc; n=4 rabbits. (n) Schematic of rat anterior cruciate ligament transection (ACLT) injury model. (o) Running time on rotarod of rats in n. Data are mean ± SD; *p≤0.05, **p≤0.01; significance is relative to time at week 1 within same group; repeated measures one-way ANOVA; n=6 rats. (p) Running time of rats depicted in n. Data presented are mean running time ± SD; #p≤0.05, ##p≤0.01; repeated measures one-way ANOVA; n=6 rats. (q) Running time on rotarod of rats depicted in n. Data presented are mean running time ± SD; *p≤0.01; **p≤0.01, ***p≤0.001; two-way ANOVA followed by Tukey’s post hoc; n=6 rats. (r) Safranin O staining of rat knees in n. (s) OARSI score of knee joints in n. Data are mean score ± SD; *p≤0.05, **p≤0.01; one-way ANOVA followed by Tukey’s post hoc; n=3 rats. (t) Immunohistochemistry of MMP13 in rat knee joints from n. (u) The area of MMP13 expression in t. Data are mean ± SD; *p≤0.05, **p≤0.01; one-way ANOVA followed by Tukey’s post hoc; n=3 rats. (v) Immunohistochemistry of βCATENIN in knee joints from rats in n. (w) The percentage of nuclear βCatenin+ cells from immunostaining in v. Data are mean percent ± SD; *p≤0.05, **p≤0.01; one-way ANOVA followed by Tukey’s post hoc; n=3 rats.
