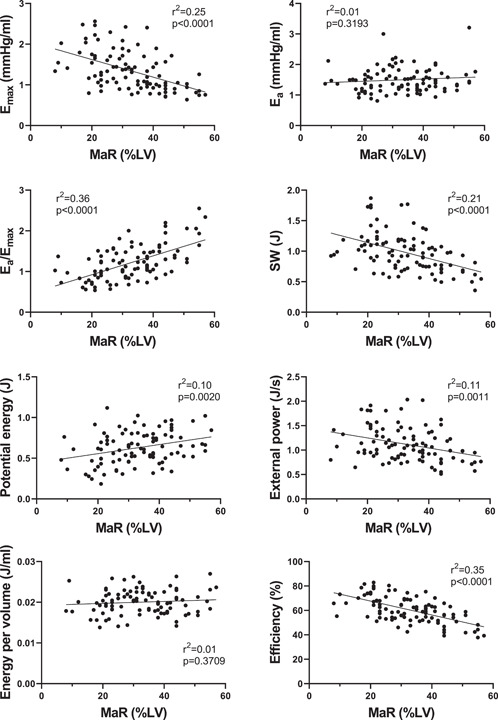
Figure 3.

PV loop variables versus myocardium at risk in STEMI patients (n = 100 for all graphs). The full line shows linear regression. Pearson's correlation coefficient was used to assess the relationship between the variables and MaR. Ea, arterial elastance; Emax, maximal elastance; LV, left ventricle; MaR, myocardium at risk; STEMI, ST‐elevation myocardial infarction; SW, stroke work.
