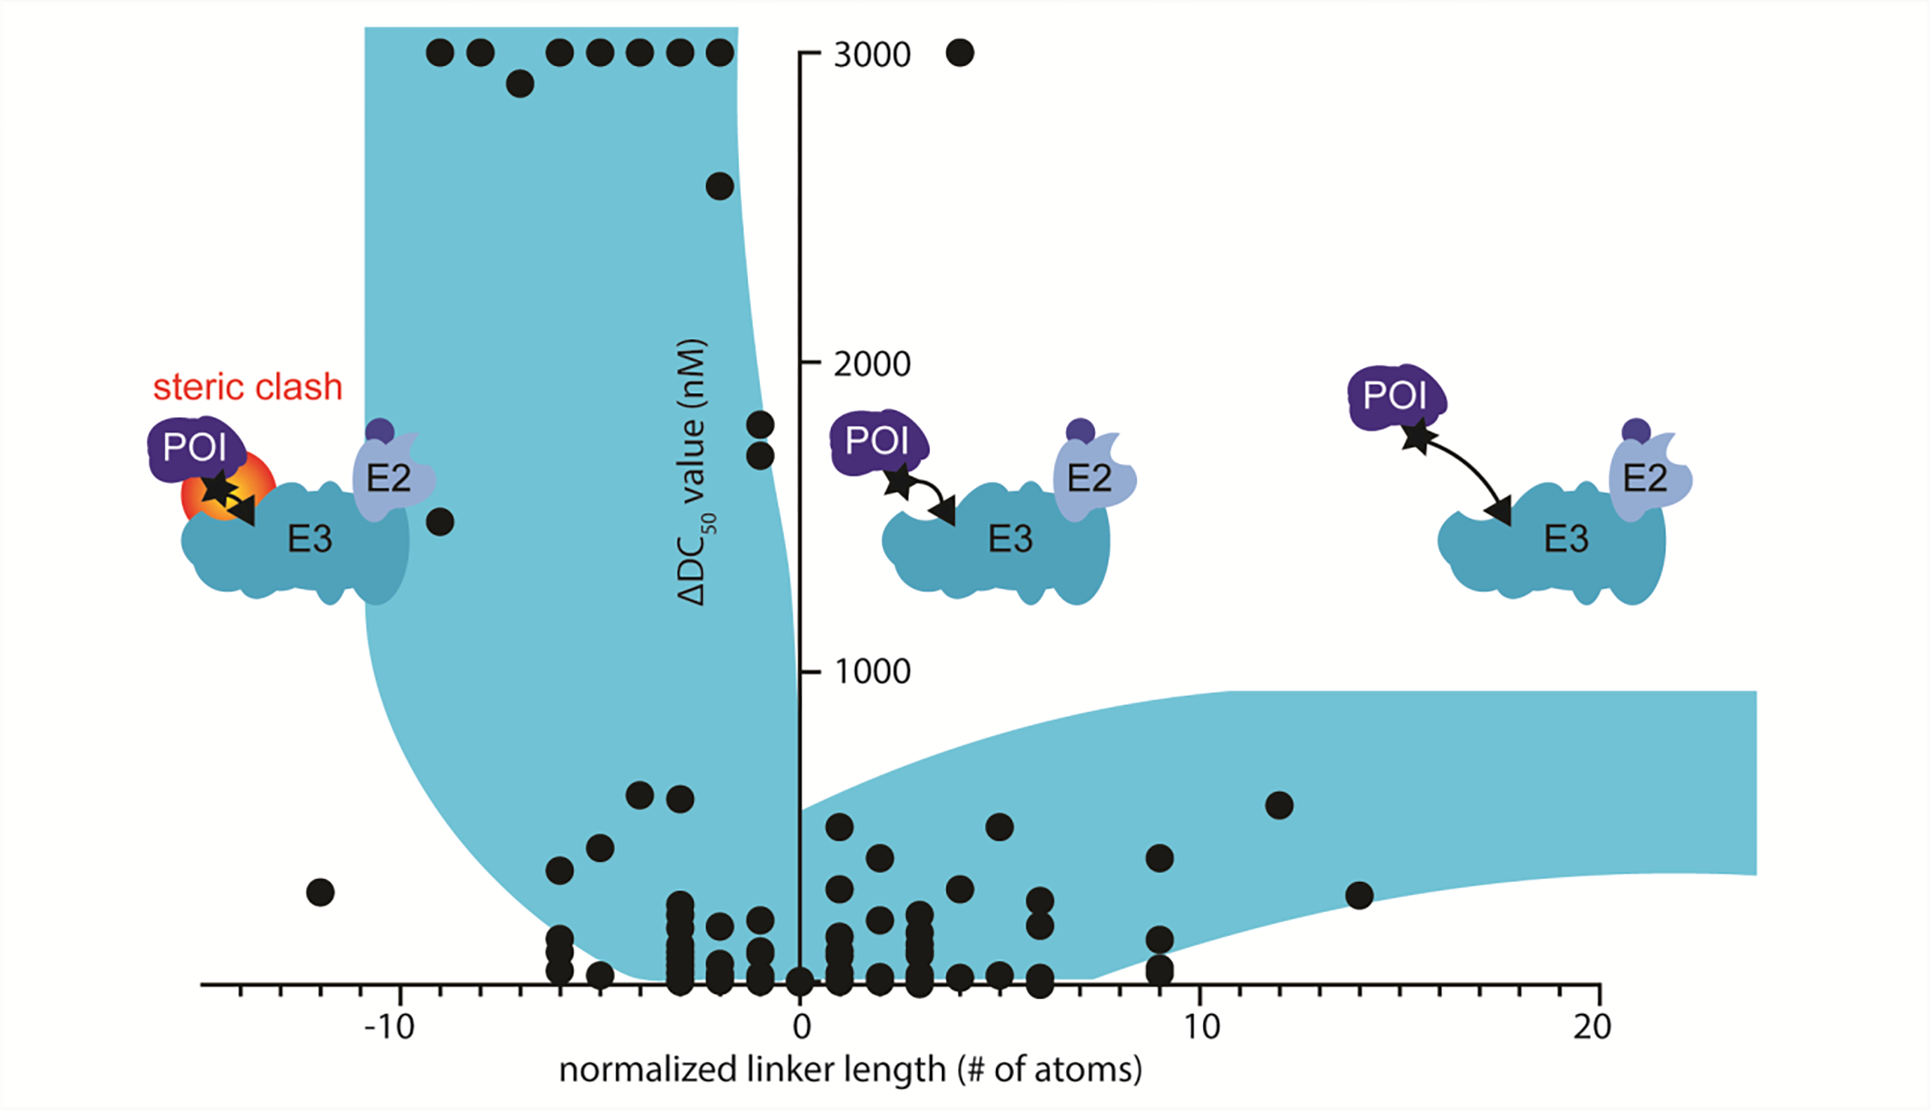
Figure 6.

Representation of the qualitative inferences made. Qualitatively we describe this trend in three zones. Left of center represents a region where steric clash can hinder successful ternary complex formation leading to a sharp drop off in degradation potency. Center represents the most potent degraders. Right of center represents the diminishing degradation potency due to increased entropy associated with longer linkers.
