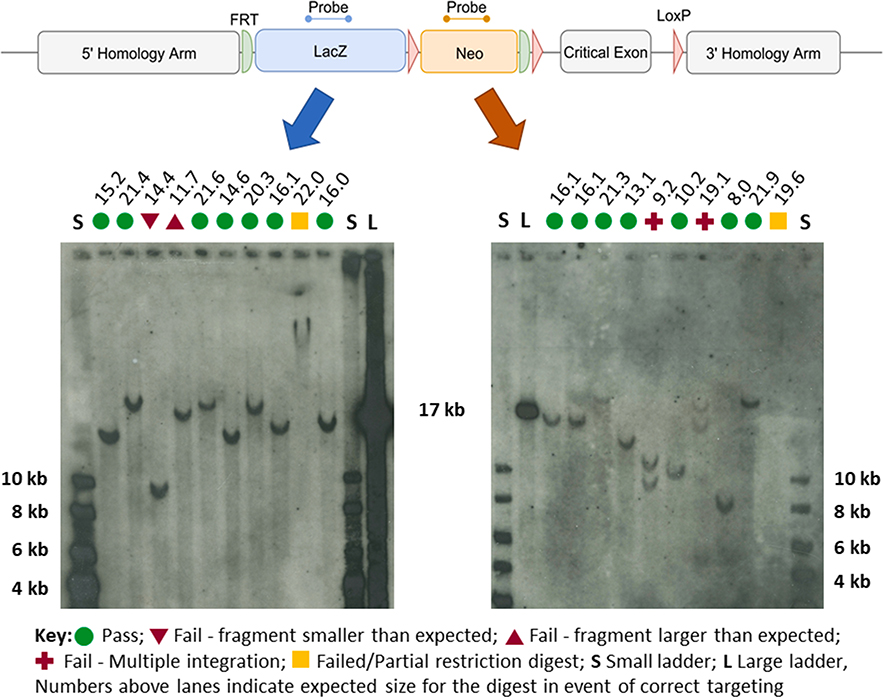
Fig. 3.
Example of Southern blot results obtained with DIG-labelled probes. A, Map of a typical tm1a targeted allele [1] with position of lacZ (blue) and neo (red) probes. B, Examples of Southern blot autoradiographs obtained using either the lacZ probe (left hand side) or neo probe (right hand side) of tm1a ES cell clones. Each blot has two size standards; a small ladder (S) and a large ladder (L), with their sizes indicated in bold. The expected size (kb) of each of the visualised fragments is displayed above each of the lanes. The interpretation of each line is indicated by symbols as per the key.

