Fig 4.
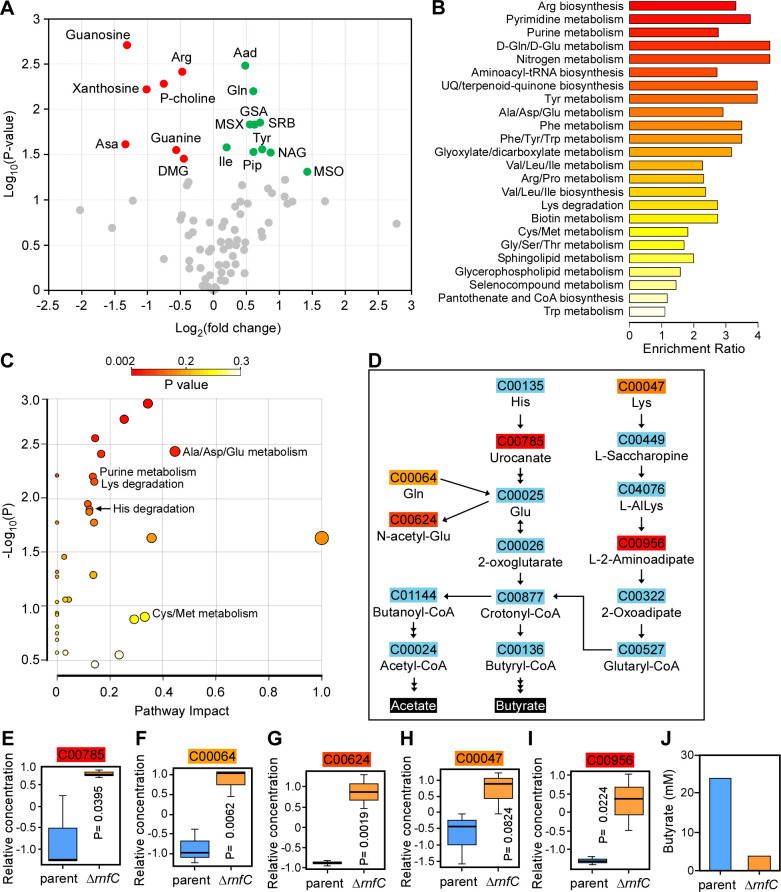
Deletion of rnfC disrupts amino acid metabolism. (A) The parent and ΔrnfC cells grown to mid-log phase were subjected to metabolomics analysis using liquid chromatography-mass spectrometry (LC-MS). Shown is a volcano plot of 81 differentially expressed metabolites (DEMs) between the parent and ΔrnfC mutant strains. Metabolites significantly depleted or enriched in the ΔrnfC strain, relative to the parent, are marked in red or green, respectively. (B) Shown is a graphical overview of quantitative enrichment analysis of DEMs between the parent and ∆rnfC strains generated using MetaboAnalyst 5.0. The top 24 pathway-associated metabolic sets in ∆rnfC compared to the parent strain were sorted based on their fold enrichment and P-values. (C) Pathway analysis was performed using MetaboAnalyst 5.0, which combines pathway enrichment and topology analysis. A range of P-values is shown from red to yellow. (D) Shown are amino acid metabolic nodes in F. nucleatum, based on the significance level in (C), generating acetate and butyrate. (E–I) The relative concentrations of DEMs in the amino acid nodes shown in (D) between the parent and ΔrnfC mutant strains are presented. P-values were calculated using the global test. (J) The relative level of butyrate (mM) in the overnight cultures of the parent and ΔrnfC strains was determined by LC-MS.

