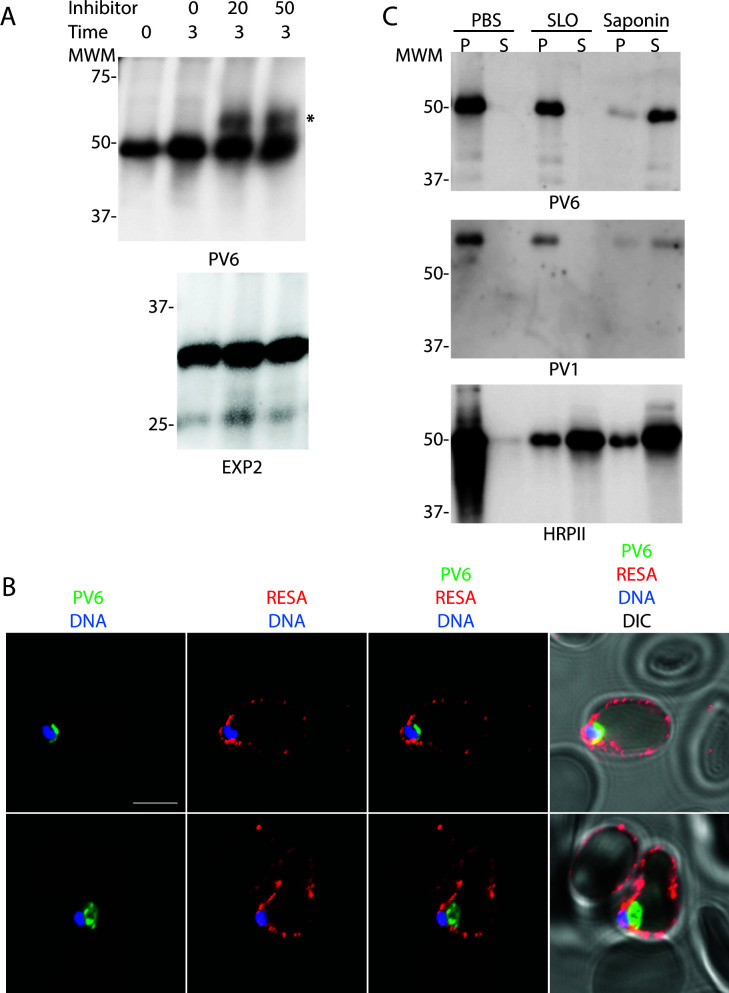
Fig 2.
Role of Plasmepsin V in the processing of PV6 and localization of PV6 after invasion. (A) Parasites were treated with the indicated amount (in µM) of the PM V inhibitor WEHI-1252601 for 3 h. Parasite extracts were separated by SDS-PAGE and probed with antibodies against PV6 (top panel) and EXP2 (bottom panel). Note the presence of a higher molecular mass band in the inhibitor-treated samples in the anti-PV6 (indicated with *) but not the anti-EXP2 immunoblot. Expected sizes of unprocessed PV6 and PV6 processed by PM V: 53.6 and 46.4kD, respectively. (B) Localization of PV6 and RESA immediately after invasion of 3D7 parasites. Invasion was synchronized with ML10, and samples were collected within 2 h after the removal of ML10. Note that the erythrocyte at the top of the panel is also infected and therefore also displays anti-RESA staining but that the parasite in that cell is outside of the plane of focus (see Fig. S2A for a maximum projection of the image). The scale bar represents 5 µm. (C) Differential lysis of erythrocytes infected with trophozoite-stage parasites with streptolysin O (SLO) and saponin. Infected erythrocytes were treated with PBS, SLO, or saponin, the erythrocytes were pelleted, and the supernatant (S) and pellet (P) were collected. Samples were prepared for immunoblotting and probed with antibodies against the indicated proteins. Note the similarity in the release of PV6 and the parasitophorous vacuole marker PV1 in the samples.

