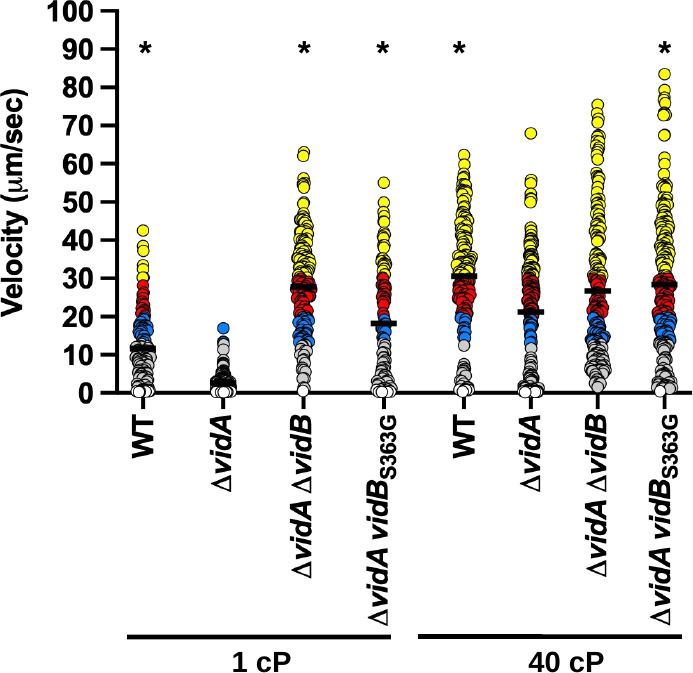
Fig 6.

Swimming velocity of C. jejuni ΔvidA with or without vidB mutations at low and high viscosities. Swimming velocity of WT, ΔvidA, ΔvidA ΔvidB, and ΔvidA vidBS363G after growth for 24 h in MH broth alone (1 cP) or MH broth methylcellulose (40 cP). Swimming velocities of individual cells (n > 100) were measured by video tracking under dark-field microscopy. Assays were performed in triplicate and combined. Bar represents the mean swimming velocity of the population. Circles represent individual cells with velocities of <1 µm/s (white), 1–13 μm/s (gray), 13–20 μm/s (blue), 20–30 μm/s (red), and >30 µm/s (yellow). Statistical significance of difference in swimming velocities of ΔvidA at 1 or 40 cP compared to other strains grown in media of the same viscosity was calculated by one-way ANOVA followed by Tukey’s multiple comparisons test. *P < 0.05.
