Figure 4.

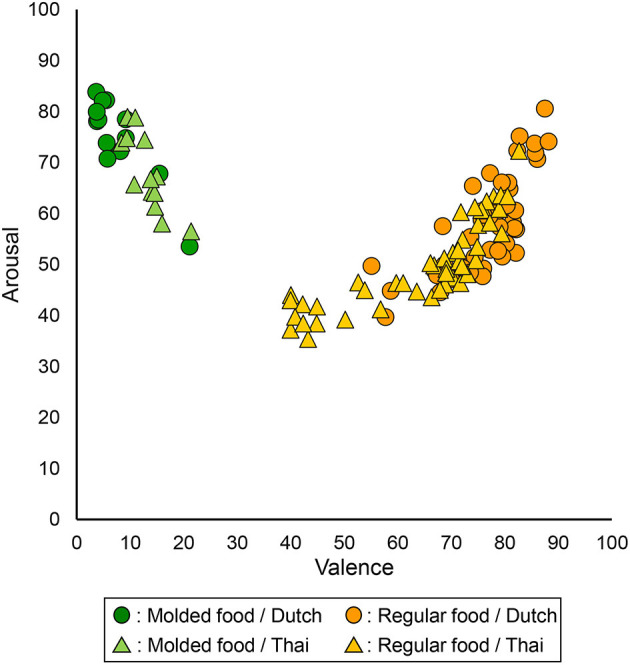
Mean valence (x-axis) and arousal (y-axis) scores for all 60 universal (regular and molded) food images. Each data point represents the mean score from either Dutch or Thai participants for each food image.

Mean valence (x-axis) and arousal (y-axis) scores for all 60 universal (regular and molded) food images. Each data point represents the mean score from either Dutch or Thai participants for each food image.