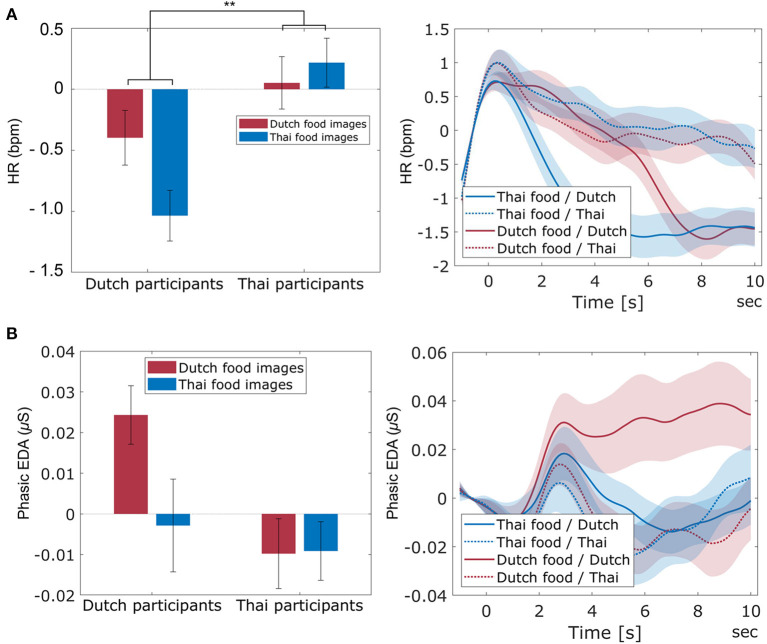
Figure 8.
The averaged HR (A-left) and phasic EDA (B-left) across participant nationality (Dutch and Thai) and cultural food image category (Dutch and Thai). Error bars indicate standard error of the mean. The figures at the right side indicate the averaged trace of HR (A) and phasic EDA (B) across participant nationality and cultural food image category during image viewing, with t = 0 indicating fixation cross offset, and food image onset. The light-shaded areas indicate standard error of the mean. ** indicates a significant interaction between participant nationality and cultural food image category with p < 0.01.

