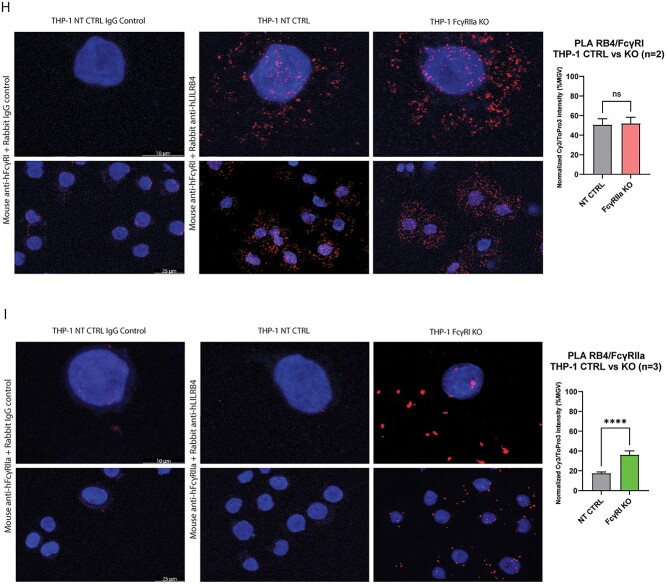
Figure 4.
(Continue) (H, I) THP-1 NT CTRL and FcγRIIa KO cells (n = 2) (H) or THP-1 NT CTRL and FcγRI KO cells (n = 3) (I) were treated with h128-3 (5 μg/ml; 2.5 × 10⁵ cells) for 2 h and fixed on slides. Fixed cells were blocked for 1 h at RT, stained for 18 h at 4°C with mouse anti-hFcγRI/anti-hFcγRIIa and control Rabbit anti-hIgG (all 5 μg/ml) or mouse anti-hFcγRI/anti-hFcγRIIa and rabbit anti-hLILRB4 (all 5 μg/ml) and then stained with the Sigma Duolink Orange (Cy3) PLA kit. Nuclei were stained with ToPro3 and slides were sealed with ProLong Gold Antifade Mountant (ThermoFisher) before imaging with the 63× objective of a Leica TCS SP5 confocal microscope. Five representative images were collected for quantitative analysis of each sample. Image analysis was performed with Leica LAS X software. PLA colocalization signal (Cy3) intensity was normalized to nuclear stain (ToPro3) intensity on all samples. Experimental sample intensities were normalized to mean IgG control sample intensity.

