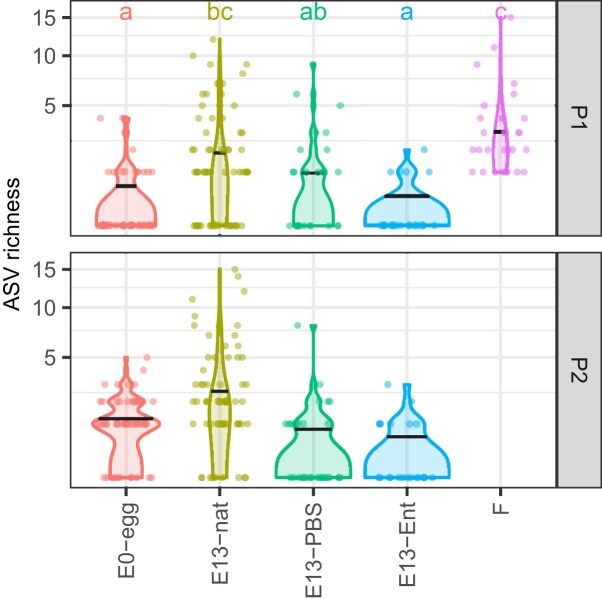
Figure 3.
Comparison of amplicon sequence variant (ASV) richness between biological sample types using violin plot in the great tit. Results for two PCR protocols are shown (P1 and P2, see the section ‘Methods’ for more details). The black horizontal lines within the violin plots indicate the median values. Lower case letters in the upper part of the plot indicate significant differences between groups according to Tukey post hoc tests. If the letters for two groups are different, the groups differ significantly in their mean ASV richness (P < .05). For visual purposes only, the y-axis is squared root scaled.

