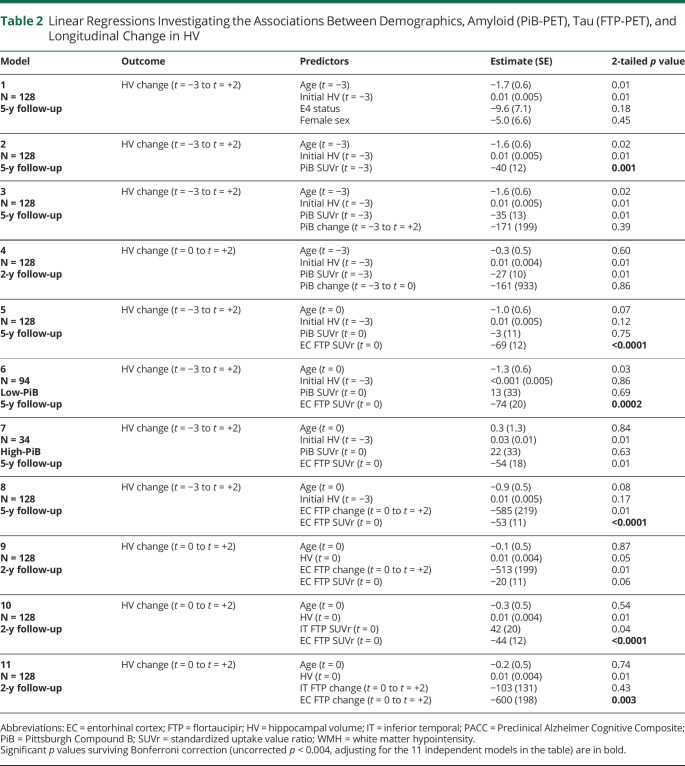
Table 2.
Linear Regressions Investigating the Associations Between Demographics, Amyloid (PiB-PET), Tau (FTP-PET), and Longitudinal Change in HV
| Model | Outcome | Predictors | Estimate (SE) | 2-tailed p value |
| 1 N = 128 5-y follow-up |
HV change (t = −3 to t = +2) | Age (t = −3) Initial HV (t = −3) E4 status Female sex |
−1.7 (0.6) 0.01 (0.005) −9.6 (7.1) −5.0 (6.6) |
0.01 0.01 0.18 0.45 |
| 2 N = 128 5-y follow-up |
HV change (t = −3 to t = +2) | Age (t = −3) Initial HV (t = −3) PiB SUVr (t = −3) |
−1.6 (0.6) 0.01 (0.005) −40 (12) |
0.02 0.01 0.001 |
| 3 N = 128 5-y follow-up |
HV change (t = −3 to t = +2) | Age (t = −3) Initial HV (t = −3) PiB SUVr (t = −3) PiB change (t = −3 to t = +2) |
−1.6 (0.6) 0.01 (0.005) −35 (13) −171 (199) |
0.02 0.01 0.01 0.39 |
| 4 N = 128 2-y follow-up |
HV change (t = 0 to t = +2) | Age (t = −3) Initial HV (t = −3) PiB SUVr (t = −3) PiB change (t = −3 to t = 0) |
−0.3 (0.5) 0.01 (0.004) −27 (10) −161 (933) |
0.60 0.01 0.01 0.86 |
| 5 N = 128 5-y follow-up |
HV change (t = −3 to t = +2) | Age (t = 0) Initial HV (t = −3) PiB SUVr (t = 0) EC FTP SUVr (t = 0) |
−1.0 (0.6) 0.01 (0.005) −3 (11) −69 (12) |
0.07 0.12 0.75 <0.0001 |
| 6 N = 94 Low-PiB 5-y follow-up |
HV change (t = −3 to t = +2) | Age (t = 0) Initial HV (t = −3) PiB SUVr (t = 0) EC FTP SUVr (t = 0) |
−1.3 (0.6) <0.001 (0.005) 13 (33) −74 (20) |
0.03 0.86 0.69 0.0002 |
| 7 N = 34 High-PiB 5-y follow-up |
HV change (t = −3 to t = +2) | Age (t = 0) Initial HV (t = −3) PiB SUVr (t = 0) EC FTP SUVr (t = 0) |
0.3 (1.3) 0.03 (0.01) 22 (33) −54 (18) |
0.84 0.01 0.63 0.01 |
| 8 N = 128 5-y follow-up |
HV change (t = −3 to t = +2) | Age (t = 0) Initial HV (t = −3) EC FTP change (t = 0 to t = +2) EC FTP SUVr (t = 0) |
−0.9 (0.5) 0.01 (0.005) −585 (219) −53 (11) |
0.08 0.17 0.01 <0.0001 |
| 9 N = 128 2-y follow-up |
HV change (t = 0 to t = +2) | Age (t = 0) HV (t = 0) EC FTP change (t = 0 to t = +2) EC FTP SUVr (t = 0) |
−0.1 (0.5) 0.01 (0.004) −513 (199) −20 (11) |
0.87 0.05 0.01 0.06 |
| 10 N = 128 2-y follow-up |
HV change (t = 0 to t = +2) | Age (t = 0) HV (t = 0) IT FTP SUVr (t = 0) EC FTP SUVr (t = 0) |
−0.3 (0.5) 0.01 (0.004) 42 (20) −44 (12) |
0.54 0.01 0.04 <0.0001 |
| 11 N = 128 2-y follow-up |
HV change (t = 0 to t = +2) | Age (t = 0) HV (t = 0) IT FTP change (t = 0 to t = +2) EC FTP change (t = 0 to t = +2) |
−0.2 (0.5) 0.01 (0.004) −103 (131) −600 (198) |
0.74 0.01 0.43 0.003 |
Abbreviations: EC = entorhinal cortex; FTP = flortaucipir; HV = hippocampal volume; IT = inferior temporal; PACC = Preclinical Alzheimer Cognitive Composite; PiB = Pittsburgh Compound B; SUVr = standardized uptake value ratio; WMH = white matter hypointensity.
Significant p values surviving Bonferroni correction (uncorrected p < 0.004, adjusting for the 11 independent models in the table) are in bold.

