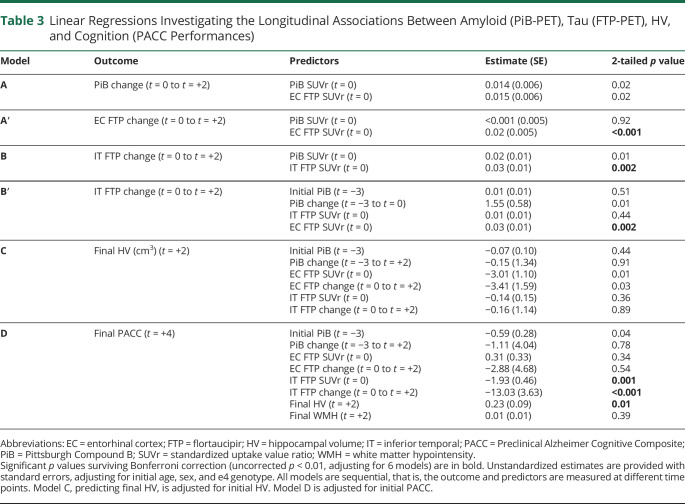
Table 3.
Linear Regressions Investigating the Longitudinal Associations Between Amyloid (PiB-PET), Tau (FTP-PET), HV, and Cognition (PACC Performances)
| Model | Outcome | Predictors | Estimate (SE) | 2-tailed p value |
| A | PiB change (t = 0 to t = +2) | PiB SUVr (t = 0) EC FTP SUVr (t = 0) |
0.014 (0.006) 0.015 (0.006) |
0.02 0.02 |
| A′ | EC FTP change (t = 0 to t = +2) | PiB SUVr (t = 0) EC FTP SUVr (t = 0) |
<0.001 (0.005) 0.02 (0.005) |
0.92 <0.001 |
| B | IT FTP change (t = 0 to t = +2) | PiB SUVr (t = 0) IT FTP SUVr (t = 0) |
0.02 (0.01) 0.03 (0.01) |
0.01 0.002 |
| B′ | IT FTP change (t = 0 to t = +2) | Initial PiB (t = −3) PiB change (t = −3 to t = 0) IT FTP SUVr (t = 0) EC FTP SUVr (t = 0) |
0.01 (0.01) 1.55 (0.58) 0.01 (0.01) 0.03 (0.01) |
0.51 0.01 0.44 0.002 |
| C | Final HV (cm3) (t = +2) | Initial PiB (t = −3) PiB change (t = −3 to t = +2) EC FTP SUVr (t = 0) EC FTP change (t = 0 to t = +2) IT FTP SUVr (t = 0) IT FTP change (t = 0 to t = +2) |
−0.07 (0.10) −0.15 (1.34) −3.01 (1.10) −3.41 (1.59) −0.14 (0.15) −0.16 (1.14) |
0.44 0.91 0.01 0.03 0.36 0.89 |
| D | Final PACC (t = +4) | Initial PiB (t = −3) PiB change (t = −3 to t = +2) EC FTP SUVr (t = 0) EC FTP change (t = 0 to t = +2) IT FTP SUVr (t = 0) IT FTP change (t = 0 to t = +2) Final HV (t = +2) Final WMH (t = +2) |
−0.59 (0.28) −1.11 (4.04) 0.31 (0.33) −2.88 (4.68) −1.93 (0.46) −13.03 (3.63) 0.23 (0.09) 0.01 (0.01) |
0.04 0.78 0.34 0.54 0.001 <0.001 0.01 0.39 |
Abbreviations: EC = entorhinal cortex; FTP = flortaucipir; HV = hippocampal volume; IT = inferior temporal; PACC = Preclinical Alzheimer Cognitive Composite; PiB = Pittsburgh Compound B; SUVr = standardized uptake value ratio; WMH = white matter hypointensity.
Significant p values surviving Bonferroni correction (uncorrected p < 0.01, adjusting for 6 models) are in bold. Unstandardized estimates are provided with standard errors, adjusting for initial age, sex, and e4 genotype. All models are sequential, that is, the outcome and predictors are measured at different time points. Model C, predicting final HV, is adjusted for initial HV. Model D is adjusted for initial PACC.

