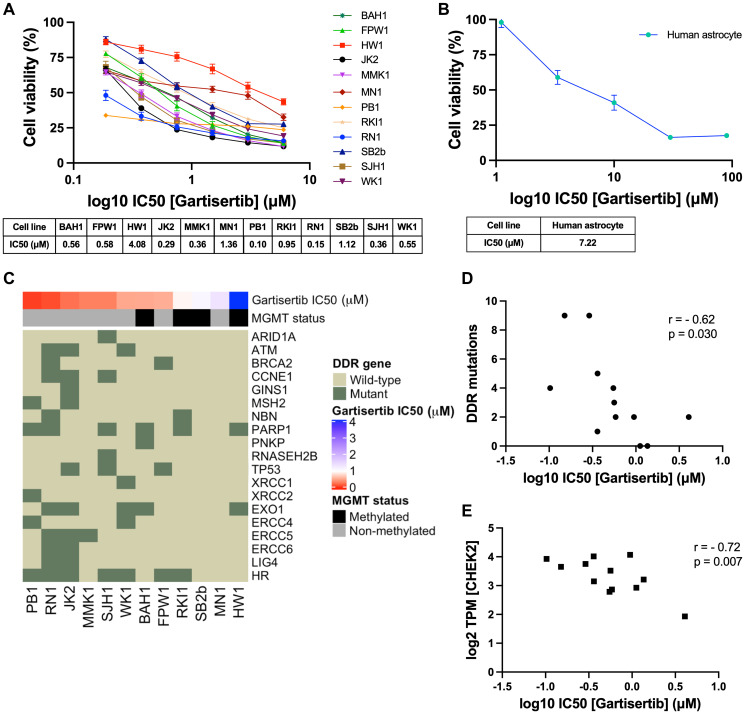
Figure 1. Single agent activity of gartisertib in 12 patient-derived glioblastoma cell lines and association with DDR mutations and gene expression.
(A) Dose-response of gartisertib treated glioblastoma cell lines (median IC50 = 0.56 μM). (B) Dose response of an astrocyte cell line treated with gartisertib (IC50 = 7.22 μM). Data points represent the mean ± SEM cell viability (%) of biological triplicates undertaken in three independent experiments. (C) Heatmap depicting gartisertib sensitivity, MGMT methylation status and baseline DDR gene mutation in the 12 glioblastoma cell lines. A trend is apparent where more gartisertib sensitive cell lines have higher amounts of DDR mutations and are MGMT unmethylated. See Supplementary Table 1 for specific SNVs and zygosity of such genes within each cell line. (D) Pearson correlation of the frequency of identified baseline mutations in DDR-related genes vs. log10 gartisertib IC50, showing a correlation of higher DDR mutations with lower gartisertib IC50 (r = −0.62, p = 0.03) (E) Pearson correlation of gartisertib log10 IC50 vs. CHEK2 gene expression (log2 TPM) within the 12 glioblastoma cell lines, in which higher expression of CHEK2 correlated with gartisertib sensitivity (r = −0.72, p = 0.007). Baseline RNA-seq expression for each cell line published by Stringer et al. [27] was used for correlation analysis. P < 0.05 was considered significant.

