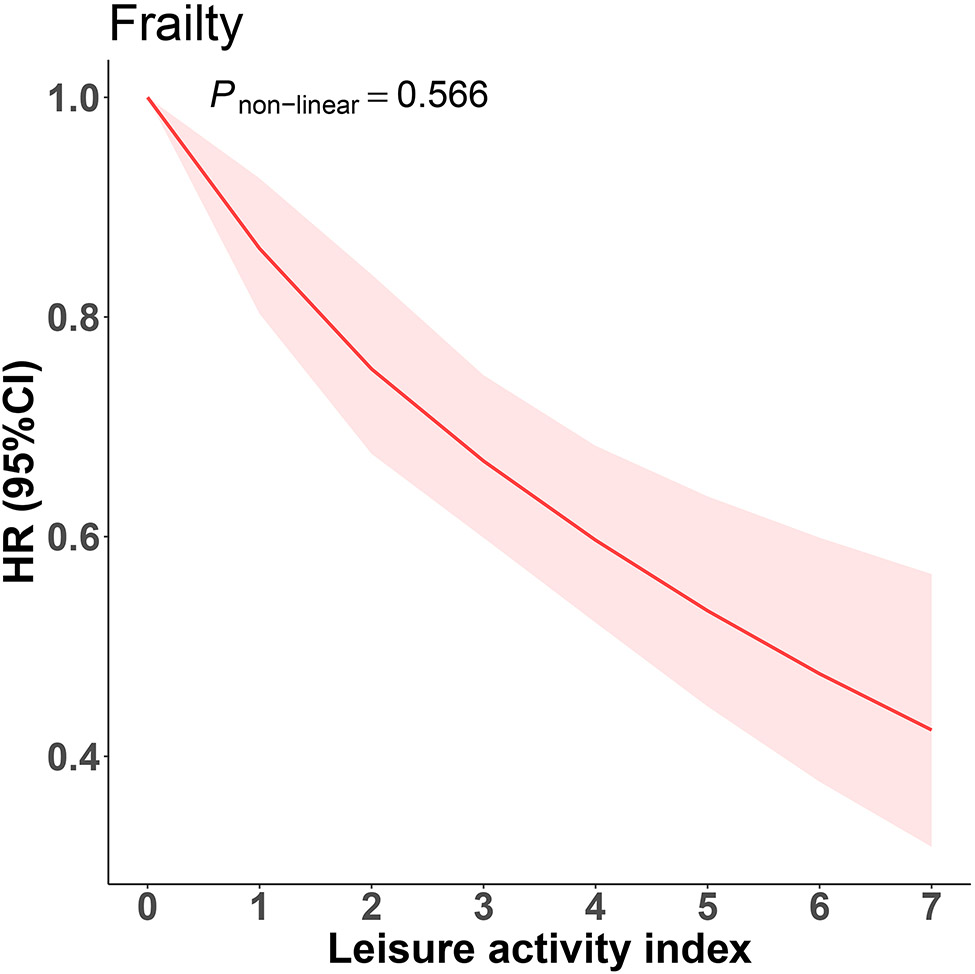
Fig. 2. The non-linear association between leisure activity index and frailty.
Abbreviations: HR, hazard ratio; CI, confidence interval.
The curve was plotted using Cox proportional hazards models with restricted cubic splines with 3 knots, adjusted for age, sex, race, residence, education, living arrangement, marital status, income level, drinking, smoking, exercise, dietary diversity and body mass index. Shading area indicates 95% CIs.

