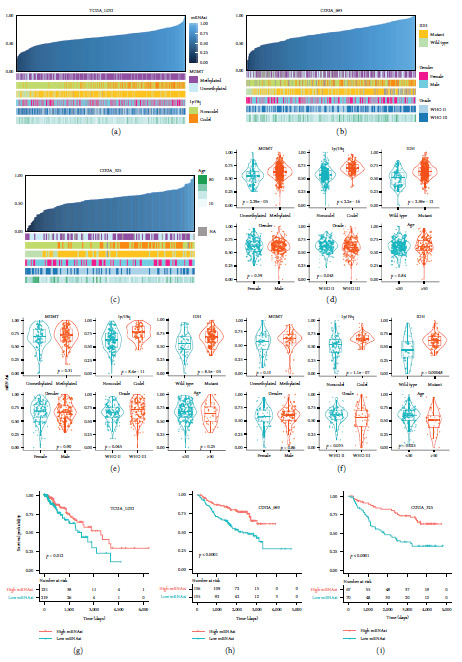
Figure 1.

The clinical features associated with the mRNAsi index in LGG patients. (a–c) The overview of the correlation between mRNAsi and clinical features for TCGA-LGG, CGGA-693, and CGGA-325 cohorts. Columns represent LGG samples ranked by mRNAsi from low to high. (d–f) Violin plots of mRNAsi in LGG patients classified by MGMT methylation, 1p/19q codeletion, IDH mutation, gender, grade, and age for TCGA-LGG, CGGA-693, and CGGA-325 cohorts. Differential analysis between the LGG groups was estimated by the Student's t-test. (g–i) Kaplan–Meier survival plots for stemness-high and stemness-low patients for TCGA-LGG, CGGA-693, and CGGA-325 cohorts.
