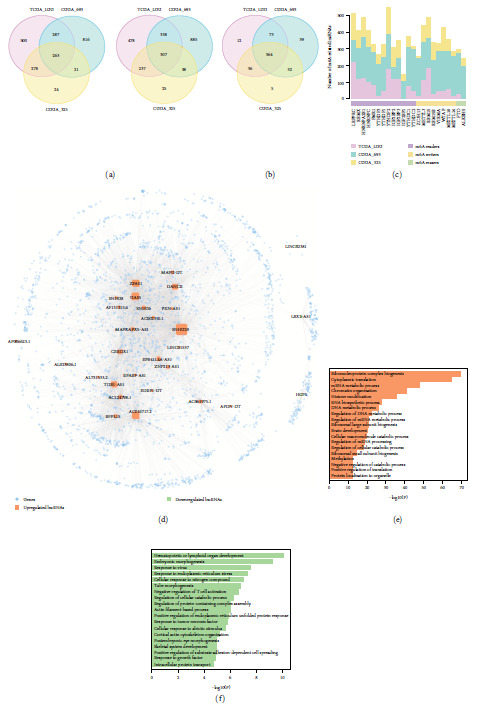
Figure 2.

Identification and functional analysis of m6A-related lncRNAs between stemness groups. (a) Venn plot showing the overlap of upregulated and downregulated lncRNAs among TCGA-LGG, CGGA-693, and CGGA-325 cohorts. Differential analysis between the LGG groups was estimated by the Wilcoxon's rank sum tests. (b) Venn plot showing the overlap of m6A-related lncRNAs among LGG cohorts. (c) The distribution of m6A regulators for regulating lncRNAs across LGG cohorts. (d) The ceRNA network for m6A-related lncRNAs. The circle node represents protein-coding genes, the square node represents lncRNAs, and the node size reflects the note degree in the network. (e, f) The enriched biological process of genes linked with upregulated and downregulated genes in the ceRNA network.
