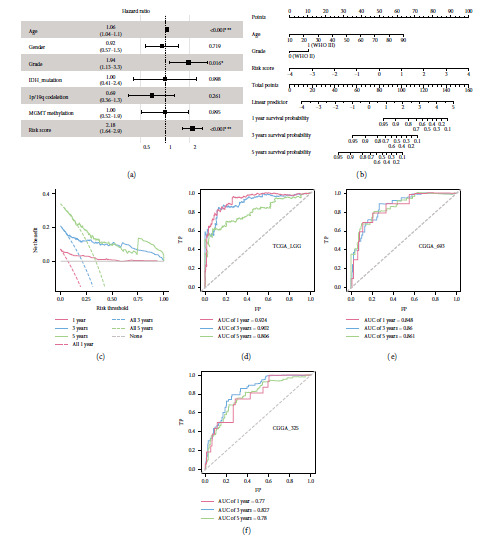
Figure 4.

Prognostic independence evaluation and nomogram construction. (a) Forest plot for the multivariable Cox regression model in TCGA training dataset. (b) Nomogram constructed by the age, grade, and risk score for predicting 1-, 3-, and 5-year OS. (c) Decision curve of the nomogram for 1-, 3-, and 5-year OS. (d–f) Time-dependent ROC of the nomogram points for predicting 1-, 3-, and 5-year OS outcome for TCGA-LGG, CGGA-693, and CGGA-325 cohorts.
