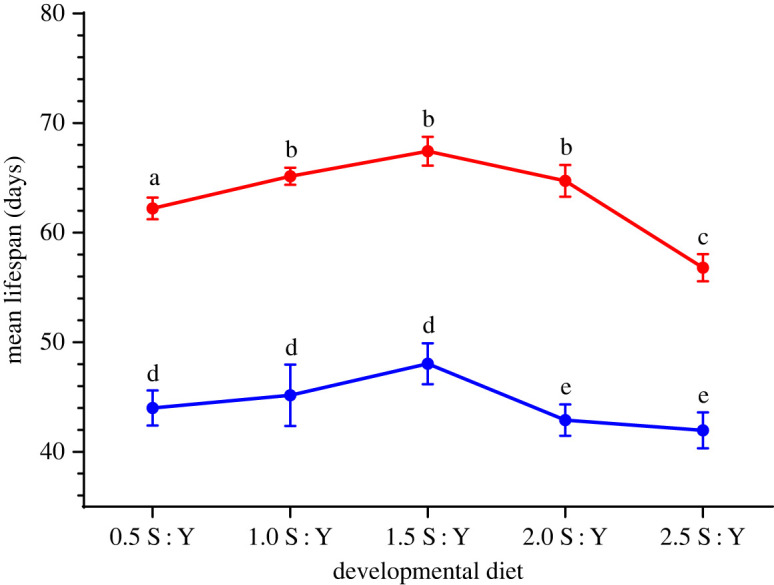
Figure 3.

Drosophila serrata mean lifespan on developmental diets. Mean adult female (red bars) and male (blue bars) lifespan measured in days is shown for the 1.5 S : Y evolutionary diet transferred to every other developmental diet. Error bars represent the 1 s.e. of the mean. Letters indicate significance in planned comparisons between 1.5 S : Y control and novel diets within sexes.
