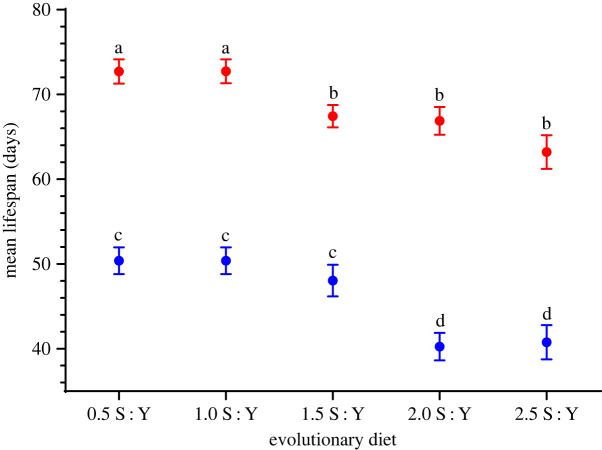
Figure 4.
Drosophila serrata mean lifespan on evolutionary diets. Mean adult female (red bars) and male (blue bars) lifespan measured in days is shown for every evolutionary diet transferred to the 1.5 S : Y ancestral diet. Error bars represent the 1 s.e. of the mean. Letters indicate significance in planned comparisons between 1.5 S : Y control and novel diets.

