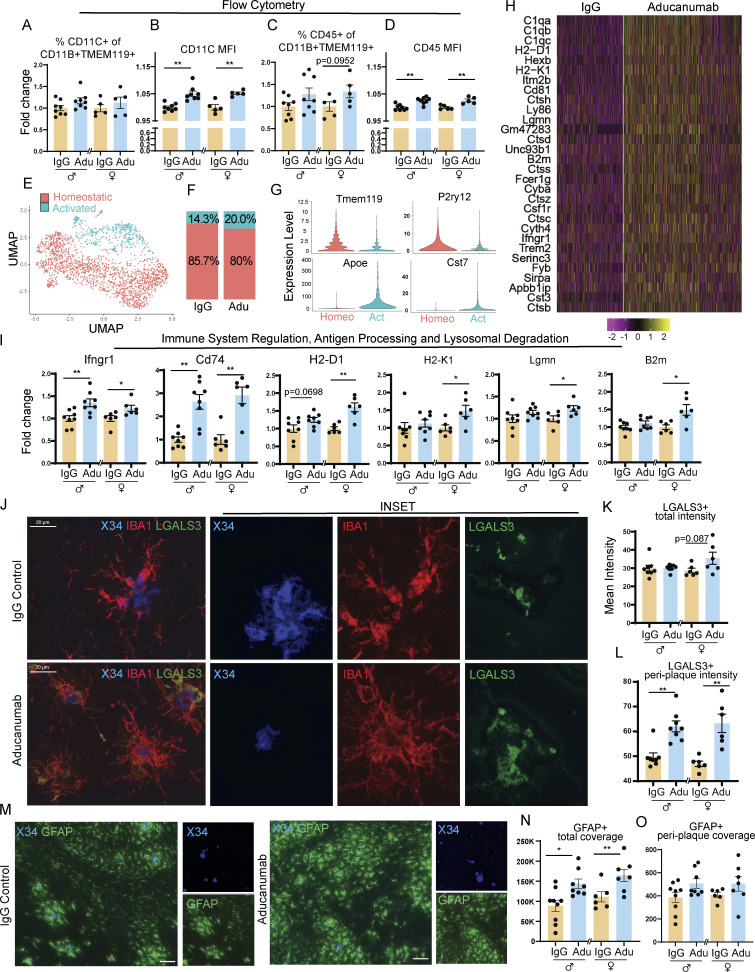
Figure 2.
Aducanumab increases microglial activation, upregulates pro-clearance genes, and recruits microglia and astrocytes to plaques during acute treatment phases. (A–D) Flow cytometry data showing (A) percent of activated CD11C+ microglia, (B) mean fluorescence intensity of CD11C within the CD11C+ microglia population, (C) percent of activated CD45+ microglia, and (D) mean fluorescence intensity of CD45+ within the CD45+ microglia population, following four 40 mg/kg doses of aducanumab (Adu) or IgG control. Microglia were identified as CD11B+ TMEM119+ live cells. (E) UMAP projection of microglia subcluster from scRNAseq analysis, following four doses of aducanumab (N = 2 male mice/treatment). (F) Percent of homeostatic and activated cells in the microglia subcluster in aducanumab- or IgG-treated mice. (G) Violin plots of canonical homeostatic and activated microglial genes used to identify homeostatic and activated microglial subclusters. (H) Heatmap showing the top 30 most highly upregulated genes in aducanumab versus IgG control mice, with P_val_adj < 0.05. (I) RT-qPCR data from bulk hemiforebrain tissue showing relative expression of genes involved in immune system regulation, antigen processing, and lysosomal degradation, including validation of targets from the scRNAseq experiment. (J) Representative images of X34+ plaques and LGALS3+ and IBA1+ microglia following four doses of IgG control or aducanumab. (K) Quantification of total mean intensity of LGALS3+ microglia after four doses, related to J. (L) Quantification from Sholl analysis of mean intensity of LGALS3+ microglia 5 µm from plaques after four doses, related to J. (M) Representative images of X34+ plaques and GFAP+ astrocytes following two doses. (N) Quantification of total GFAP+ astrocyte coverage after two doses, related to M. (O) Quantification from Sholl analysis of GFAP+ astrocyte coverage 15 µm from plaques after two doses, related to L. Scale bars in J = 20 µm; scale bars in M = 100 µm. A–D and I expressed as fold change relative to IgG control of the same sex. *P < 0.05; **P < 0.01, Student’s t test for normally distributed samples with no significant difference in variance (A females; B females; C; D; I: Ifngr1, Lgmn, B2m, Cd74 males, H2-D1, H2-K1 females; K females; N), Welch’s t test for normally distributed samples with differences in variances (I: Cd74 females; L females; O females), Mann–Whitney test for non-normally distributed samples (A males; B males; I: H2-K1 males; K males; L males; O males), with males and females analyzed separately. N = 5–9 mice/sex/treatment.

