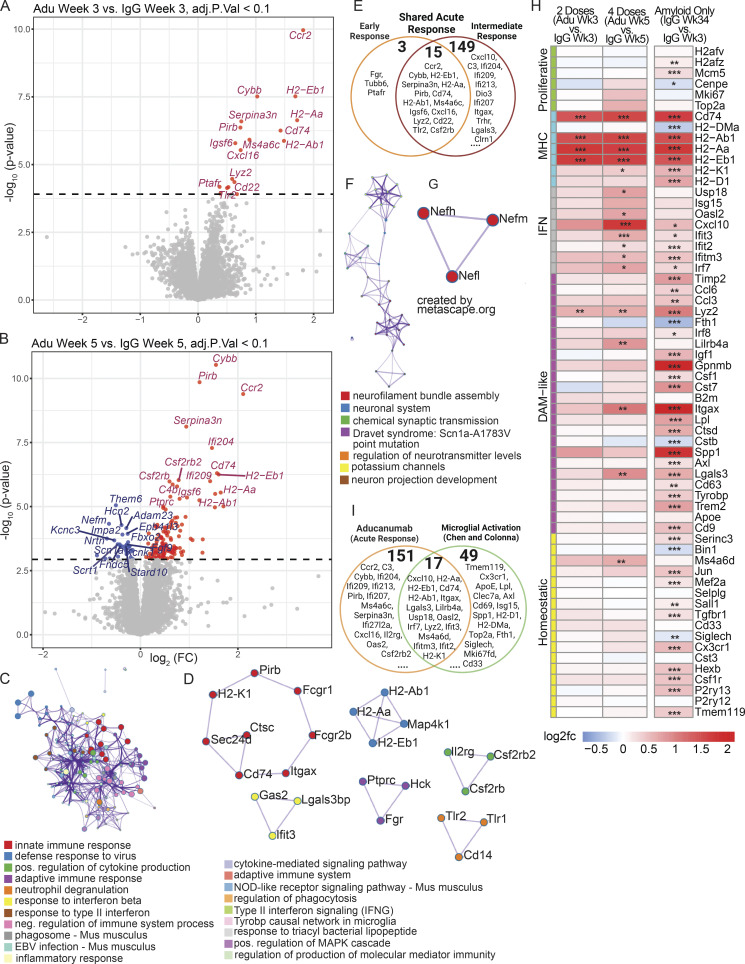
Figure 3.
Bulk RNAseq reveals the global acute aducanumab signature is dominated by immune genes. (A and B) Volcano plots showing DEGs from bulk RNAseq of bulk hemiforebrain tissue following (A) two or (B) four 40 mg/kg doses of aducanumab (Adu) or IgG control. Gene names displayed are the top 15 upregulated and downregulated genes. (C and D) Metascape (C) gene ontology and (D) protein–protein interaction analysis of all genes upregulated in aducanumab treatment at weeks 3 and 5. (E) Venn diagram showing genes differentially expressed at either week 3 only (early response), week 5 only (intermediate response), or at both weeks (shared acute response). (F and G) Metascape (F) gene ontology and (G) protein–protein interaction analysis of all genes downregulated in aducanumab treatment at week 5. (H) Heatmap of selected canonical microglial activation genes curated by Chen and Colonna (2021) from multiple studies of microglial activation, showing differential expression of these genes after two doses of aducanumab (week 3 aducanumab versus week 3 IgG), four doses of aducanumab (week 5 aducanumab versus week 5 IgG), and aged amyloid only (week 34 IgG versus week 3 IgG, or 31 wk of aging in APP/PS1 mice). (I) Venn diagram showing the overlap of genes differentially expressed during aducanumab treatment with genes from the Chen and Colonna list. N = 4 mice/sex/treatment/time point, significance at adjusted P val < 0.1 with FDR correction (statistics computed with analysis in edgeR; see Materials and methods for additional details). For heatmaps, *P_val_adj < 0.1, **P_val_adj < 0.05; ***P_val_adj < 0.01.

