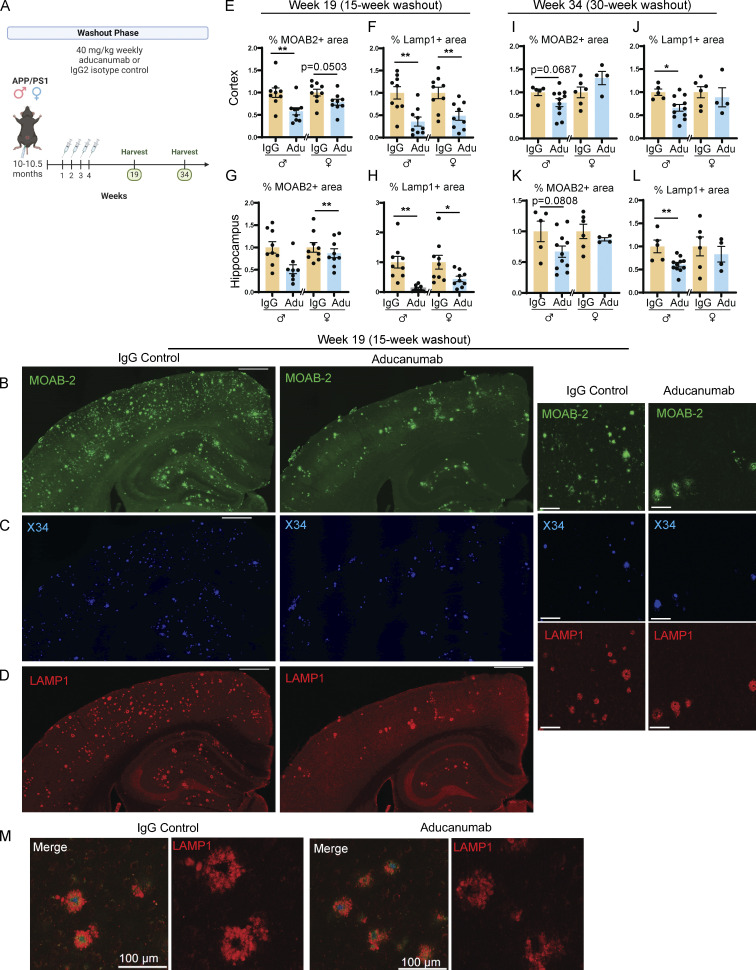
Figure 4.
Reduction of amyloid load is sustained 15 but not 30 wk after cessation of aducanumab treatment. (A) Timeline of the withdrawal phase of the study. 10- to 10.5-mo-old male and female APP/PS1 mice received four doses of aducanumab or IgG control (40 mg/kg, IP injection) and were harvested either 15 or 30 wk after the final dose. (B–D) Representative images of (B) total Aβ marked by MOAB-2, (C) X34 fibrillar plaques, and (D) neuritic dystrophy marked by LAMP1, in male mice treated with four doses of aducanumab or IgG control, and harvested 15 wk after final treatment. (E and F) Quantification of the percent of the tissue covered by MOAB-2+ (E) and LAMP1+ staining in the cortex (F), following a 15-wk washout period. (G and H) Quantification of percent of the tissue covered by MOAB-2+ (G) and LAMP1+ staining in the hippocampus (H), following a 15-wk washout period. (I and J) Quantification of percent of tissue covered by MOAB-2+ (I) and LAMP1+ (J) staining in the cortex, following a 30-wk washout period. (K and L) Quantification of percent of tissue covered by MOAB-2+ (K) and LAMP1+ (L) staining in the hippocampus, following a 30-wk washout period. (M) LAMP1+ neuritic dystrophy surrounding amyloid plaques in following a 15-wk washout period. Scale bars in B–D = 500 µm for whole tissue view, 100 µm for insets; scale bars in M = 100 µm. Data in E–L expressed as fold change relative to IgG control of the same sex. *P < 0.05; **P < 0.01, Student’s t test for normally distributed samples with no significant difference in variance (E females; F; G; I females; J; K males; L), Welch’s t test for normally distributed samples with differences in variances (H; K females), Mann–Whitney test for non-normally distributed samples (E males; I males), with males and females analyzed separately. N = 4–11 mice/sex/treatment.

