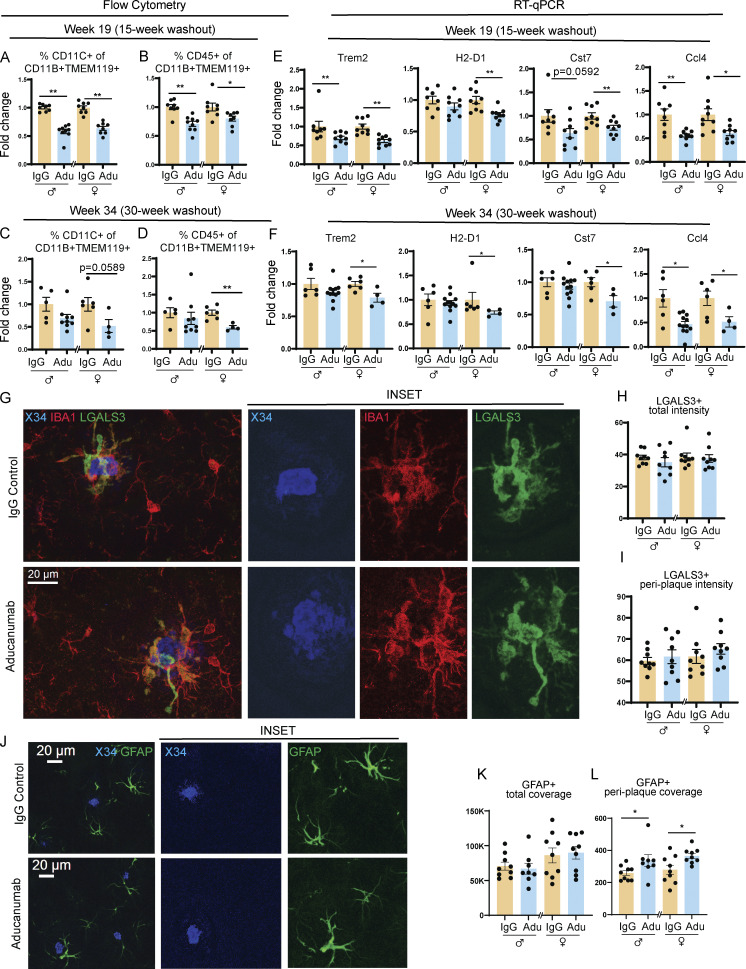
Figure 5.
Microglial activation is blunted up to 30 wk after aducanumab treatment. (A and B) Flow cytometry data showing percent of activated (A) CD11C+ and (B) CD45+ microglia 15 wk after four doses of 40 mg/kg IgG control or aducanumab (Adu). (C and D) Percent of activated (C) CD11C+ and (D) CD45+ microglia 30 wk after four doses of 40 mg/kg IgG control or aducanumab. Microglia were identified as CD11B+ TMEM119+ live cells. (E and F) RT-qPCR from bulk hemiforebrain tissue showing relative expression of microglial activation genes (E) 15 wk or (F) 30 wk after four doses of IgG control or aducanumab. (G) Representative images of X34+ plaques and IBA1+ and LGALS3+ microglia 15 wk after four doses of IgG control or aducanumab. (H) Quantification of total mean intensity of LGALS3+ microglia 15 wk after four doses, related to G. (I) Quantification from Sholl analysis of mean intensity of LGALS3+ microglia 5 µm from plaques, 15 wk after four doses related to G. (J) Representative images of X34+ plaques and GFAP+ astrocytes 15 wk after four doses. (K) Quantification of total GFAP+ astrocyte coverage 15 wk after four doses, related to J. (L) Quantification from Sholl analysis of GFAP+ astrocyte coverage 15 µm from plaques 15 wk after four doses, related to J. Scale bars in G = 100 µm. Scale bars in J = 20 µm. A–F expressed as fold change relative to IgG control of the same sex. *P < 0.05; **P < 0.01, Student’s t test for normally distributed samples with no significant difference in variance (A females; B females; C females; D females; E: Trem2 females, H2-D1, Cst7 females; F: Trem2 females, H2-D1 males, Cst7, Ccl4 females; H males; I males; K; L females), Welch’s t test for normally distributed samples with differences in variances (E: Ccl4; F: Ccl4), Mann–Whitney test for non-normally distributed samples (A males; B males; C males; D males; E: Trem2 males, Cst7 males; F: Trem2 males; H females; I females; L males), with males and females analyzed separately. N = 4–11 mice/sex/treatment.

