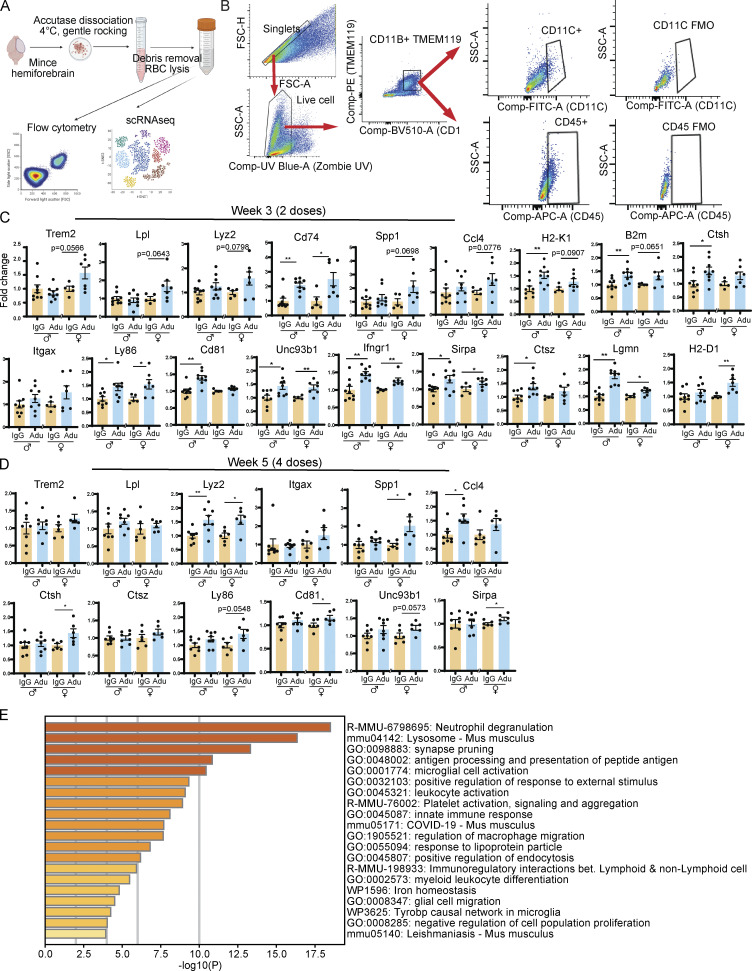
Figure S2.
Aducanumab increases microglial activation acutely. (A) Diagram showing dissociation methods used for flow cytometry and scRNAseq. (B) Flow cytometry gating strategy used for microglial analysis. Singlet gating axes—FSC-A: 0, 50K, 100K, 150K, 200K, 250K; FSC-H: 0, 50K, 100K, 150K, 200K. Live cell gating axes—UV Blue Zombie UV: −103, 0, 103, 104; SSC-A: 50K, 100K, 150K, 200K. CD11B+TMEM119+ gating axes—BV510 CD11B: −103, 0, 103, 104; PE TMEM119: −103, 0, 103, 104. CD11C+ gating axes—FITC CD11C: −103, 0, 103; SSC-A: 0, 50K, 100K. CD45+ gating axes—APC CD45: −103, 0, 103; SSC-A: 0, 50K, 100K. (C) RT-qPCR relative expression of microglial activation genes after two doses of aducanumab (Adu). (D) The same as C, but after four doses of aducanumab. All data in this figure expressed as fold change relative to IgG control within a single sex. (E) Metascape gene ontology heatmap generated from all genes significantly (P < 0.05) upregulated in aducanumab-treated mice. *P < 0.05; **P < 0.01, Student’s t test for normally distributed samples with no significant difference in variance (C: Trem2, Lpl males, Lyz2 males, Spp1 females, H2-K1, B2m males, Ctsh, Ly86 males, Cd81 females, Unc93b1 males, Ifngr1 males, Sirpa, Ctsz males, Lgmn, H2-D1 males; D: Trem2 males, Lpl, Lyz2, Itgax females, Spp1 males, Ctsh, Ctsz, Ly86, Cd81, Unc93b1, Sirpa), Welch’s t test for normally distributed samples with differences in variances (C: Lpl females, Lyz2 females, Ccl4 females, B2m females, Itgax females, Ly86 females, Unc93b1 females, Ctsz females; D: Spp1 females), Mann–Whitney test for non-normally distributed samples (C: Cd74, Spp1 males, Ccl4 males, Itgax males, Cd81 males, Ifngr1 females, H2-D1 females; D: Trem2 females, Itgax males, Ccl4), with males and females analyzed separately. N = 6–11 mice/sex/treatment.

