Figure 7.
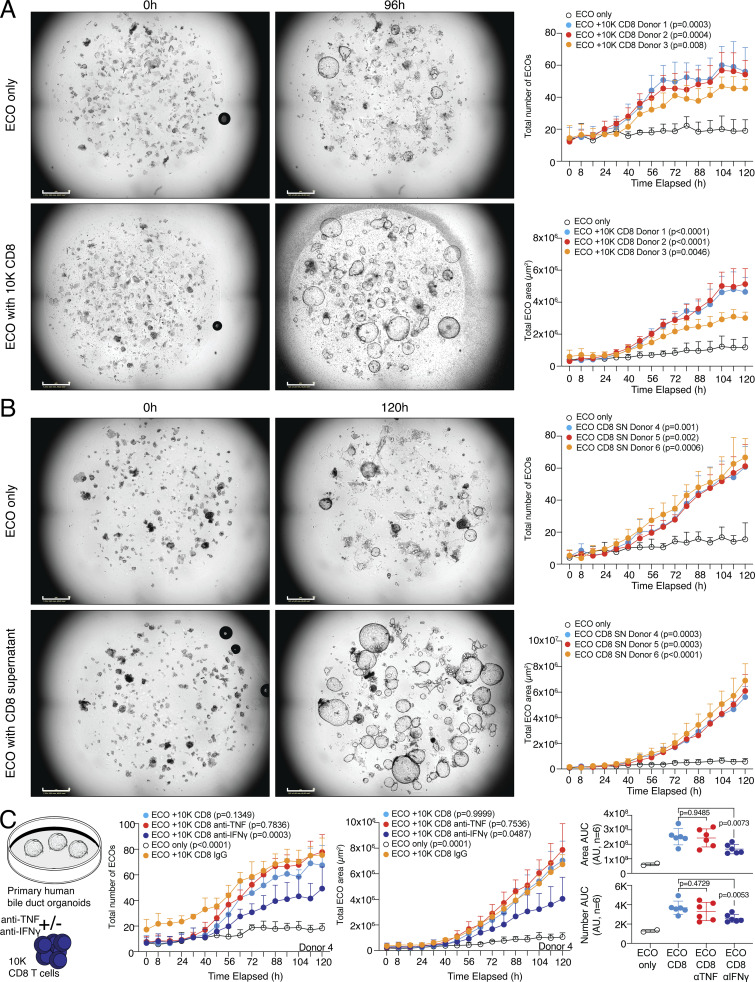
Human CD8 T effector cells can promote tissue regeneration in organoids. (A) 20 ECO organoids were dissociated and cultured alone or in coculture with 10,000 CD8 T cells derived from different donors (D1–D3) and organoid growth was observed over time. Left, representative images of organoids. Right, quantification of the number of organoids (top) and total organoid area (bottom) over cultivation time with statistical verification using AUC (n = 4 wells, one-way ANOVA, compared to ECO only). Additional individual donors are shown in Fig. S5. Growth kinetics are shown in Videos 1 and 2. Scale bars = 800 µm; enhanced for improved visibility. (B) 20 ECO organoids were dissociated and cultured alone or in coculture with cell-free SN of 200,000 activated CD8 T cells derived from different donors (D4–D6) and organoid growth was observed over time. Left, representative images of organoids. Right, quantification of the number of organoids (top) and total organoid area (bottom) over cultivation time with statistical verification using AUC (n = 4 wells, one-way ANOVA, compared to only ECO). Additional individual donors are shown in Fig. S5. Growth kinetics are shown in Videos 3 and 4. Scale bars = 800 µm; enhanced for improved visibility. (C) 20 ECO organoids were dissociated and cultured alone or in coculture with 10,000 CD8 T cells derived from different donors (D1–D6) in presence or absence of anti-IFN-γ or anti-TNF and organoid growth was observed over time. IgG served as a control. Left, experimental layout. Middle, quantification of the number of organoids and total organoid area over cultivation time from D4 (n = 4 wells, one-way ANOVA, compared to IgG). Right, quantification of organoid area and number from all donors of experiment 1 and 2 (D1–D6) combined with statistical verification using AUC from 48 h onwards (N = 6 donors, one-way ANOVA, compared with CD8, symbols indicate individual experiments). Additional individual donors from experiment 1 (D1–D3), experiment 2 (D4–D6), and experiment 3 (D9–D11) are shown in Fig. S5. All data derived from two or more independent experiments with the indicated number of replicates and donors.

