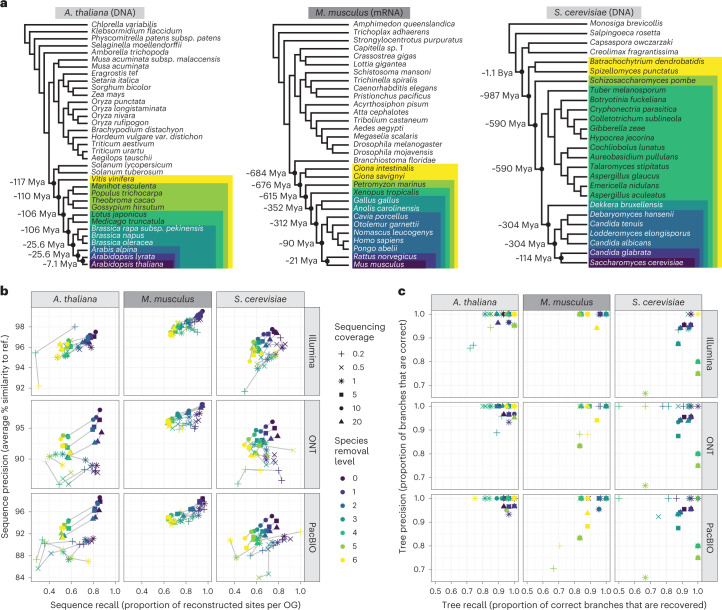
Fig. 2. Benchmark of Read2Tree using three different datasets, six different coverage levels and three sequencing technologies.
a, Phylogenetic trees of reference datasets. In dark purple (bottom) are the species used for mapping. The colors represent species removal to assess the dependency on closest neighbors in the reference datasets. Timepoints were obtained from timetree.org59. b, Read2Tree sequences are more similar (percentage identity) and more complete with increasing coverage and decreasing distance to a more closely related species. The best sequence identity is obtained for Illumina data. The colors convey the increasing evolutionary distance to the closest reference species (ref.). c, The precision and recall of trees reconstructed using Read2Tree after collapsing branches below 90% support.

