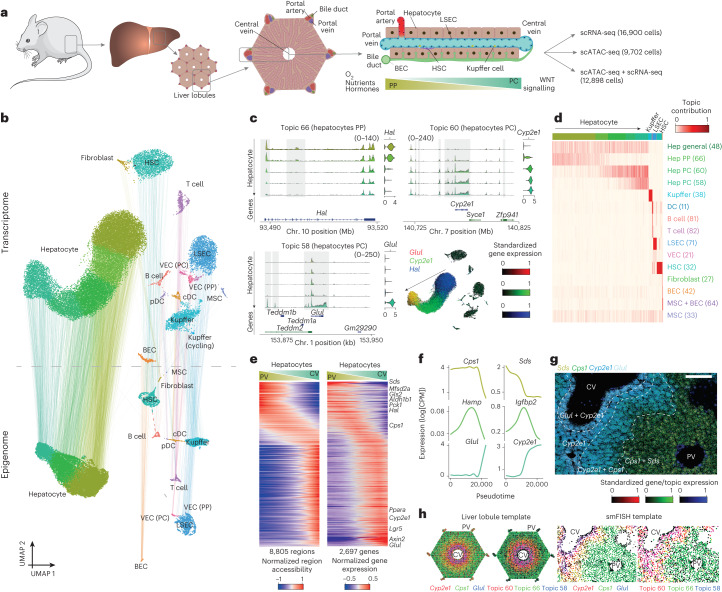
Fig. 1. A spatial single-cell multiome atlas of the mouse liver.
a, Overview of the mouse liver and the experimental set-up. The liver is composed of hexagonal structures called liver lobules, in which blood flows from the portal veins and hepatic arteries and drains in the central vein, creating a gradient of oxygen, nutrients, hormones and morphogens (such as WNT). b, Transcriptome- and epigenome-based uniform manifold approximation and projection (UMAP) projections (29,798 and 22,600 cells, respectively). The lines linking the UMAP projections connect the transcriptome and the epigenome UMAP positions from the same cell (profiled using single-cell multiomics). c, Pseudobulk chromatin profiles at different gene loci for hepatocyte zonation states, accompanied by violin plots representing the normalized gene expression of the relevant gene in each class. The UMAP projections show the gene expression of the relevant genes with RGB encoding. d, Cell topic contribution heat map. e, Normalized region accessibility and gene expression zonation heat maps. Cells are ordered by pseudotime (from periportal (PP) to pericentral (PC)), and regions and genes affected by zonation are shown (8,805 regions and 2,697 genes). The genes highlighted on the right of the gene expression heat map are located on the following ranked positions (from top to bottom): 3, 155, 201, 207, 233, 239, 866, 2,112, 2,535, 2,544, 2,556, 2,579. CV, central vein; PV, portal vein. f, GAM-fitted gene expression profiles for selected genes along the zonation pseudotime. CPM, counts per million. g, Liver section image showing smFISH profiles for Glul, Cyp2e1, Cps1 and Sds. Three independent experiments were performed with similar results. Scale bar, 100 μm. h, ScoMAP liver lobule (4,498 cells) and smFISH coloured by gene expression and topic contribution using RGB encoding. For the transcriptome and epigenome data, cells from five and four biological replicates were combined, respectively. cDCs, conventional dendritic cells; pDCs, plasmacytoid dendritic cells. Source numerical data are provided as source data.

