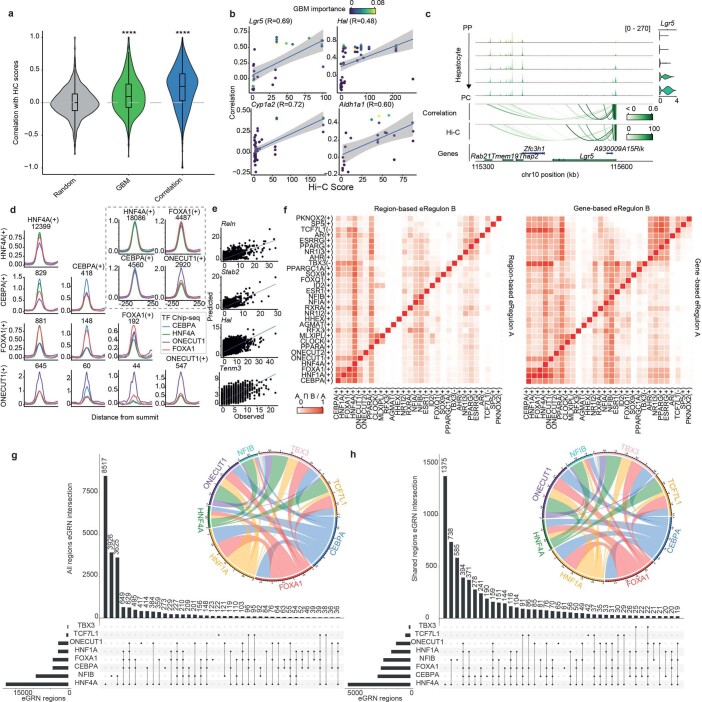
Extended Data Fig. 4. Validation of SCENIC+ regulons.
a. Violin plot showing the distribution of the correlations between SCENIC+ predicted region to gene links per gene (by the Gradient Boosting Machine (GBM) and correlation methods) with Hi-C scores (between the same regions and the Transcription Start Site (TSS) of the linked gene) for 559 hepatocyte markers genes (log2[FC] > 1 and adjusted p-value < 0.05). The random control distribution consists of shuffled correlation values. In the boxplots, the top/lower hinge represents the upper/lower quartile and whiskers extend from the hinge to the largest/smallest value no further than 1.5 × interquartile range from the hinge, respectively. The median is used as the centre. SCENIC+ was trained using transcriptome and epigenome data from 5 and 4 biological replicates, respectively. b. Examples showing the correlation between SCENIC+ region to gene links correlation scores and Hi-C scores, coloured by their GBM importance. The blue line represents the fitted linear regression line and the grey bands represent the 95% confidence interval bands. c. Example on the Lgr5locus depicting chromatin accessibility profiles and gene expression across hepatocyte subpopulations and the region to gene correlation and Hi-C scores. For the transcriptome and epigenome data, cells from 5 and 4 biological replicates were combined, respectively. d. ChIP-seq coverage profiles for HNF4A, CEBPA, FOXA1 and ONECUT1 on their unique and shared predicted regulon regions. e. Example showing the correlation between observed gene expression values (on left-out-data) and gene expression predicted using a GBM model (per gene) trained using the expression of the predicted TF regulators as features. f. Heat maps showing the overlap between selected region-based and gene-based regulons. g. Overlap between all regions included in selected regulons. h. Overlap between core regions (that is accessible across all mice) included in selected regulons. Source numerical data are available in source data.

