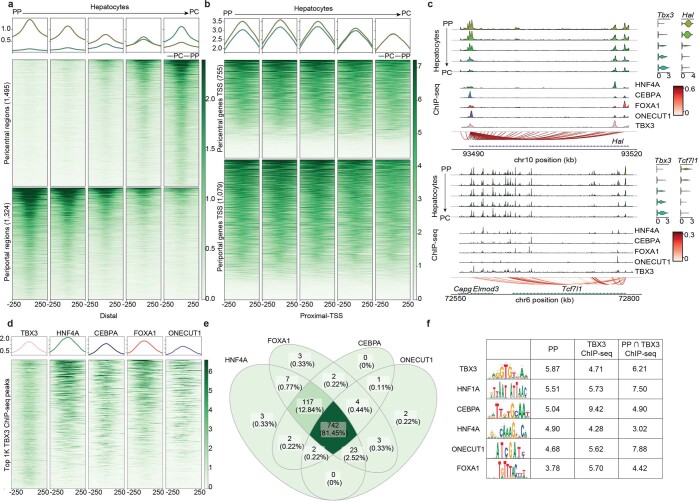
Extended Data Fig. 5. Chromatin accessibility profiles of regulatory regions of zonated genes inferred with SCENIC+ and at their TSS and validation and intersection of TBX3 and other hepatocyte TFs in periportal regions.
a, b. Coverage plots on zonated pericentral and periportal regions (a.) and at the Transcription Start Site (TSS) of zonated genes linked to these regions (b.) on mouse hepatocytes snATAC-seq pseudobulk, ordered by cluster from periportal to pericentral. c. Pseudobulk accessibility profiles, ChIP-seq coverage (for HNF4A, CEBPA, FOXA1, ONECUT1 and TBX3), SCENIC+ region to gene links coloured by correlation score and gene and Tbx3 expression across the zonated hepatocytes classes (from periportal (PP) to pericentral (PC)) are shown. The gene loci showed are Hal and Tcf7l1. For the transcriptome and epigenome data, cells from 5 and 4 biological replicates were combined, respectively. d. Coverage plot on the top 1,000 TBX3 ChIP-seq regions on HNF4A, CEBPA, FOXA1, ONECUT1, and TBX3 ChIP-seq data. e. Overlap between HNF4A, FOXA1, CEBPA and ONECUT1 regions that overlap the top 1,000 Tbx3 regions. f. Cistarget motif enrichment in periportal and TBX3 ChIP-seq regions and their overlap. Values indicate the cisTarget Normalized Enrichment Scores (NES) in the different regions sets for the indicated motifs (top motifs found in periportal regions).

