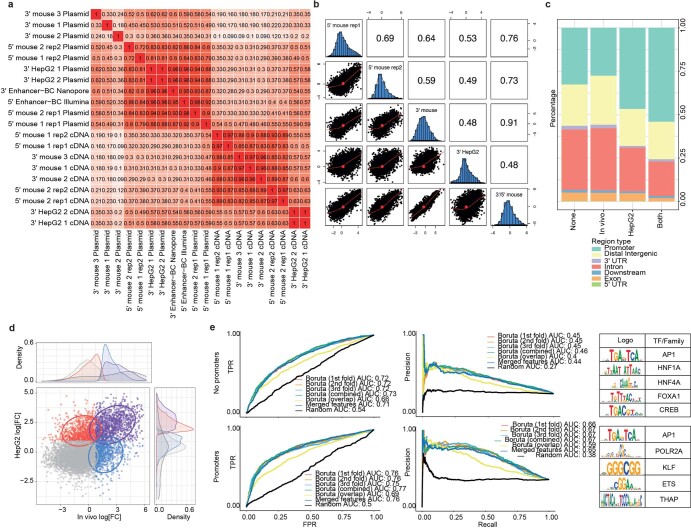
Extended Data Fig. 6. Random Forest models allow to identify sequence features driving enhancer activity.
a. Correlation between plasmid and cDNA measurements across MPRA experiments in the mouse liver and HepG2. Both 5’ experiments were performed in vivo, while one of the 3’ experiments was perfomed in vivo and the other in HepG2, respectively. b. Correlation of the MPRA log2[FC] values per enhancer across experiments. c. Proportion of enhancer classes based on genomic annotation per high confidence activity class. None: Not active (n = 4,285), In vivo: Active only in vivo (n = 806), HepG2: Active only in HepG2 (n = 921), Both: Active in HepG2 and in vivo (n = 1,186). d. Correlation between log2[FC] for high confidence enhancers (n = 7,198) in Hepg2 and in vivo coloured by enhancer type, with data ellipses per activity group: Not active (grey), active in HepG2 (red), active in vivo (blue), active both in vivo and HepG2 (purple). e. Receiver operating characteristic and precision-recall curves for the trained activity models (with and without promoters). Boruta was run using 3-fold validation, and models were trained per fold, using all features found in at least one fold or only overlapping features. Merged features are derived by using all features found in at least one fold and merged based on their CRM score correlation and motif similarity. Top selected features per model (ordered by importance) are shown on the table on the right. For the MPRA experiments, 2 and 7 biological replicates were used in vitro and in vivo, respectively. Source numerical data are available in source data.

