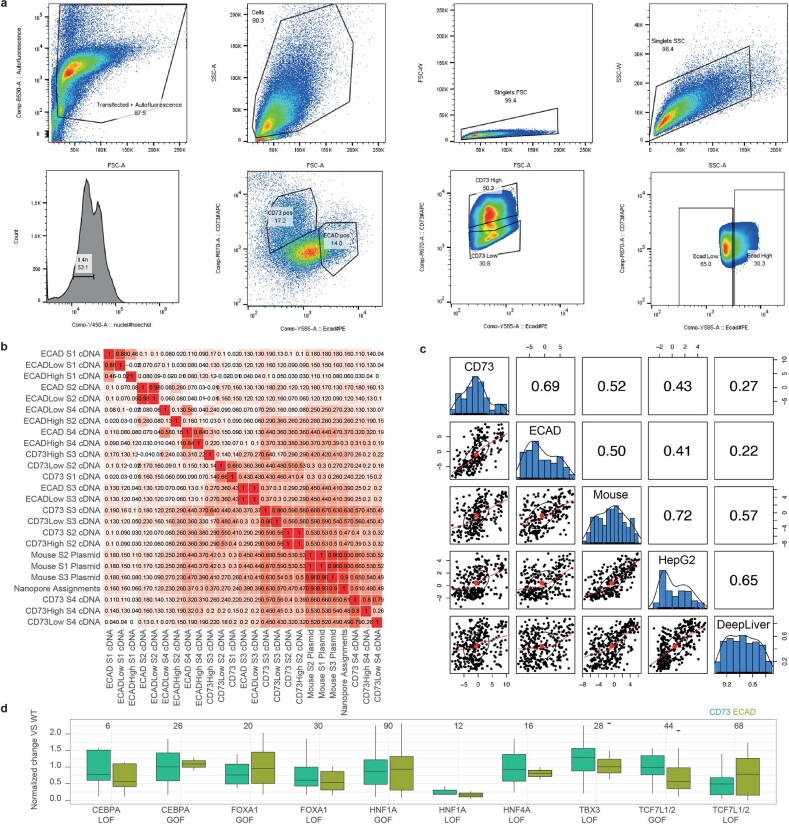
Extended Data Fig. 10. FACS MPRA reveals activity differences between pericentral and periportal enhancers.
a. FACS gating strategy. FSC-A and SSC-A were used for hepatocytes size selection. For the FACS MPRA experiment, cells containing the library were selected based on GFP. For the FACS ATAC experiment, viable cells were selected using the Zombie Green Viability kit. Tetraploid hepatocytes were selected based on Hoechst stain. CD73 and ECAD were used to select hepatocytes bins along the porto-central axis. b. Correlation between number of counts per enhancer across samples and replicates. c. Correlation between CHEQ-seq log2[FC] in the CD73+ and ECAD+ fractions, in vivo bulk and in HepG2 and DeepLiver activity predictions. d. Normalized change between enhancers (grouped by variant type) in the CD73+ and ECAD+ fractions. The number of enhancers used in each comparison is indicated over each mutational group. The top/lower hinge represents the upper/lower quartile and whiskers extend from the hinge to the largest/smallest value no further than 1.5 × interquartile range from the hinge, respectively. The median is used as the centre. Four biological replicates were used. GOF: Gain-Of-Function, LOF: Loss-of-function. PC: Pericentral, PP: Periportal, WT: Wild-type. Source numerical data are available in source data.

