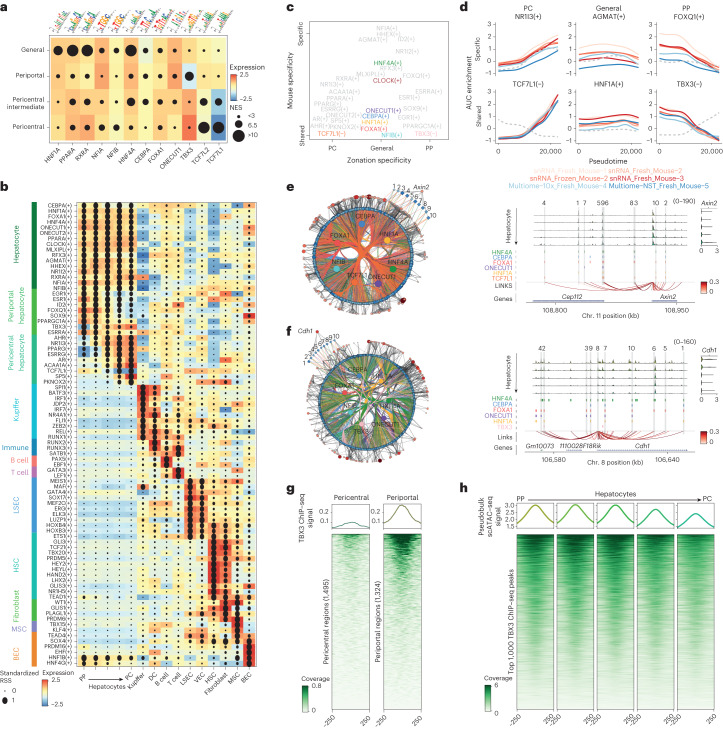
Fig. 2. Liver zonation is mediated by repression.
a, Highest normalized enrichment score (NES; circle size) for motifs linked to selected TFs in regions that are specifically accessible in different hepatocyte classes. The tiles are coloured by the expression of the corresponding TF in that hepatocyte class. b, SCENIC+ eGRN enrichment dot plot. The gene-based eRegulon specificity score (RSS) in the cell type is shown by circle size, and the colour represents the TF expression in the corresponding cell type. The symbol between brackets indicates whether the TF activates (+) or represses (-) its target genes. c, eGRN AUC based PCA plot, in which the first principal component represents the zonation specificity, and the second principal component represents whether eRegulons are shared across mice or specific to certain mice. d, GAM-fitted eGRN AUC profiles per mouse for selected eRegulons along the zonation pseudotime. The grey dotted line represents the GAM-fitted TF expression profiles. snRNA-seq samples are indicated in red, single-cell multiomics samples are indicated in blue. e, Pericentral core hepatocyte eGRN, with 265 pericentral marker genes and 1,439 regions targeted by the selected core TFs (with CRM score > 3) and conserved across mice. Hepatocyte pseudobulk accessibility profiles (from periportal to pericentral) at the Axin2 locus are shown as an example; with predicted TF-binding sites, region-to-gene links coloured by SCENIC+ correlation score and gene expression across the zonated hepatocyte classes (from periportal to pericentral). Regions in the core eGRN are highlighted in grey and numbered. Chr., chromosome. f, Periportal core hepatocyte eGRN, with 175 periportal marker genes and 972 regions targeted by the selected core TFs (with CRM score > 3) and conserved across mice. Hepatocyte pseudobulk accessibility profiles (from periportal to pericentral) at the Cdh1 locus are shown as an example; predicted TF-bindingsites, region-to-gene links coloured by SCENIC+ correlation score and gene expression across the zonated hepatocyte classes (from periportal to pericentral). Regions in the core eGRN are highlighted in grey and numbered. g, Coverage plot showing TBX3 ChIP–seq coverage at pericentral and periportal hepatocyte regions. h, Hepatocyte coverage at the top 1,000 TBX3 ChIP–seq regions. For the transcriptome and epigenome data, cells from five and four biological replicates were combined, respectively. Source numerical data are provided as source data.

