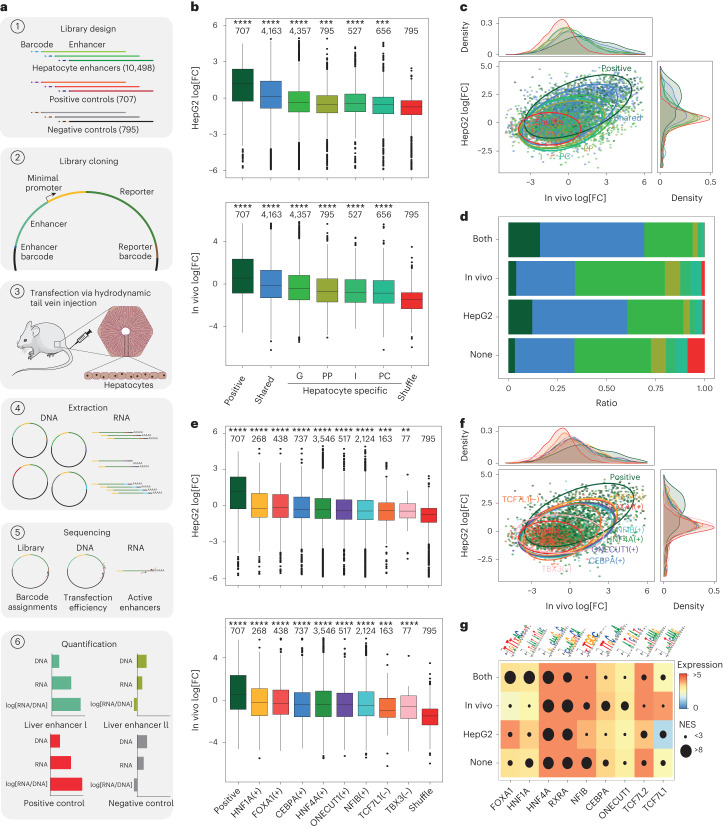
Fig. 3. MPRAs in HepG2 cells and in vivo hepatocytes uncouple enhancer accessibility and activity.
a, Schematic of MPRA of the mouse liver. b, MPRA log2-transformed fold change (log2[FC]) for each enhancer class. n = 9 biological samples. The number of enhancers in each class is specified at the top. G, general; I, intermediate. c, The correlation between log2[FC] values for high-confidence enhancers (n = 7,198) in HepG2 cells and in vivo coloured by enhancer type, with data ellipses indicating each group. d, The proportion of enhancer classes per high-confidence activity class. None, not active (n = 4,285); in vivo, active only in vivo (n = 806); HepG2, active only in HepG2 cells (n = 921); both, active in HepG2 cells and in vivo (n = 1,186). e, MPRA log2[FC] per eRegulon. n = 9 biological samples. The number of tested enhancers in each eRegulon is specified at the top. f, The correlation between log2[FC] values for high-quality enhancers (n = 7,198) in HepG2 cells and in vivo coloured by eRegulon, with data ellipses indicating each group. g, Highest normalized enrichment score (circle size) for motifs linked to selected TFs in regions in the different enhancer (MPRA) activity classes coloured by the expression of the corresponding TF in HepG2 cells, in vivo or as the average (both and none). For the box plots in b and e, the centre line shows the median value, the top and bottom hinges represent the upper and lower quartiles, and the whiskers extend from the hinge to the largest and smallest values no further than 1.5 × interquartile range from the hinge, respectively. One-sided rank-sum Wilcoxon tests were performed to assess whether the log2[FC] values of each group were greater than those of the shuffled regions. The asterisks represent the Bonferroni-adjusted P values of the comparisons; ****, P ≤ 0.0001; ***, P ≤ 0.001; **, P ≤ 0.01; *, P ≤ 0.05; NS, P > 0.05. Seven and two biological replicates were used for in vivo and HepG2 cell experiments, respectively. Source numerical data are provided as source data.

