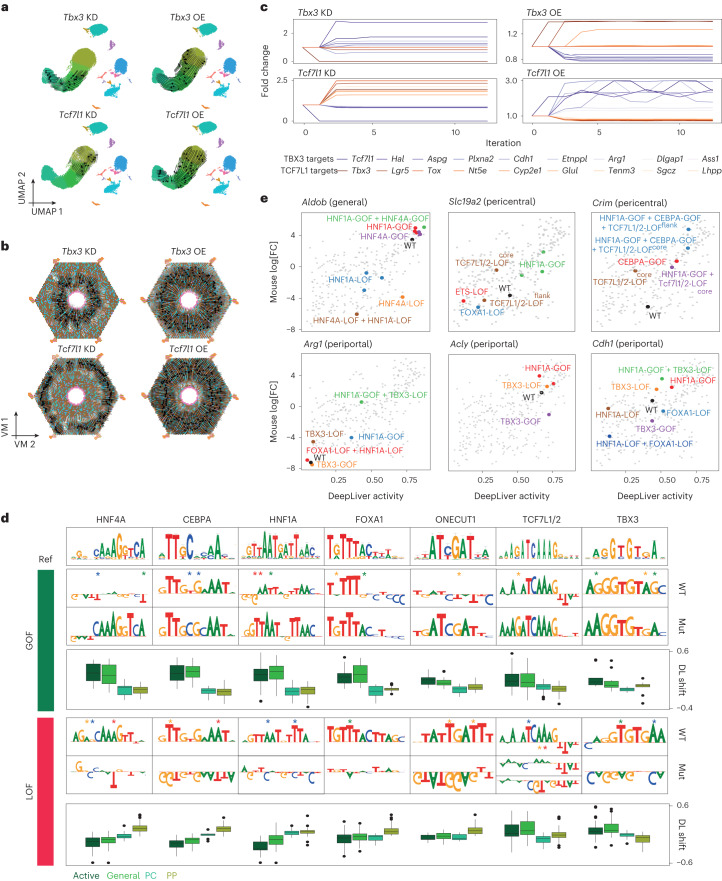
Fig. 7. Validation of zonated repressor TFs through in silico perturbation and MPRA.
a, Simulated cellular shift on the snRNA-seq UMAP (29,798 cells) after Tbx3 or Tcf7l1 knockdown (KD) or overexpression (OE), represented by arrows. The arrows are shaded based on the distance travelled by each cell after the simulation. For the UMAP, cells from four snRNA-seq and two single-cell multiome experiments were combined. b, Simulated cellular shift on the ScoMAP liver lobule virtual map (VM; 4,498 metacells) after Tbx3 or Tcf7l1 knockdown (KD) or overexpression (OE), represented by arrows. The arrows are shaded based on the distance travelled by each cell after the simulation. c, The predicted fold change for selected genes (TBX3 targets are shown in purple and TCF7L1 targets are shown in orange) after simulation of Tbx3 knockdown and Tcf7l1 overexpression in pericentral hepatocytes and Tcf7l1 knockdown and Tbx3 overexpression on periportal hepatocytes. d, Overview of DeepLiver-based sequence mutations (mut) introduced in the wild-type enhancers to shift activity and zonation patterns. These variants cause the appearance of improved motifs (GOF) or their destruction (LOF). On top, a reference TF motif (Ref) from the cisTarget database is shown. The box plots below each variant indicate DeepLiver’s predicted shift on activity (active) or zonation (general, pericentral or periportal) scores. In the box plots, the top/lower hinge represents the upper/lower quartile and whiskers extend from the hinge to the largest/smallest value no further than 1.5 × interquartile range from the hinge, respectively. The median is used as the center. DL, Deep Learning. e, In vivo MPRA log2[FC] versus the DeepLiver activity score with the highlighted sequence variants for each enhancer. For the MPRA experiments, three and eight biological replicates were performed in HepG2 cells and in vivo, respectively. Source numerical data are provided as source data.

